Analysis Projects – expedited, insightful project review

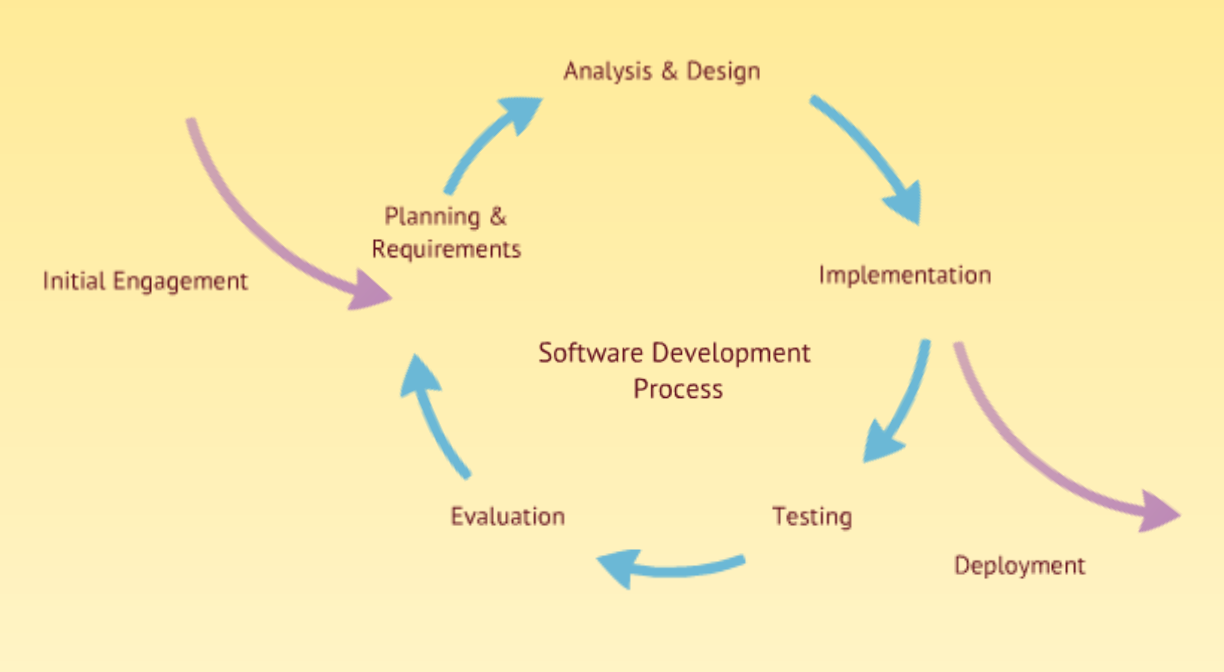
We deliver a wide range of services at Oasis Digital – training, mentoring, development, and plenty in between. Occasionally we do an “analysis project”, in which we thoroughly review a project’s code and related assets, then prepare a written report and discussion of recommendations. Customers typically request such an analysis for the usual business reasons:

  • Acquisition or investment diligence
  • Budget has gone awry
  • New opportunity drives a decision of whether to update or replace a software system
  • As part of a technology “bake-off”
  • Etc.

Although we work across a wide range of technologies, our project analysis work is focused on the technologies that we use most often, such as Angular, React, TypeScript, and Node, and many related technologies. The projects we analyze often have portions which span other technologies, and if they stray too far from areas where we have the greatest expertise, we caution customers that our analysis of those portions will be less deep.

Typical Analysis Project Scope of Work

The scope of work on an analysis project typically looks something like this:

  1. Meet with customer project managers and product owners to understand the business purposes for a project.
  2. Meet with customer developers to understand the technical background and status of the project.
  3. Study source code, documentation and other materials provided by customer.
  4. If there are multiple candidate sets of source code, use comparison tools and try to determine which is the most complete or up-to-date.
  5. To the extent possible, set up a development/test environment to execute the project. For some projects this is straightforward, rarely it proves impossible, usually it is somewhere in between.
  6. Assess use of third-party tools (open-source and commercial).
  7. Prepare a written report of our assessment and recommendations for the project.
  8. Prepare a screen video code review of some critical portions of the source code, if appropriate.
  9. One or more meetings with customer stakeholders (developers, product owners, etc.) to discuss the results.

Deliverables are:

  1. the written report
  2. optional screen video code review
  3. discussion meetings

The scope and deliverables for an analysis project do not include features, bug fixes, or other development work.  We do many projects which deliver those things – but those are not analysis projects,.

Typical analysis project report outline

An analysis report will typically include sections like so:

  1. Introduction and summary of customer situation
  2. Summary of analysis work performed
  3. Analysis of how data is stored and managed in the software as it executes
  4. Analysis of how data is persisted long-term, i.e. how data is stored to a database/files/backend/etc
  5. Listing of third-party code libraries used
  6. Assessment of the currency and future prospects of such libraries
  7. Analysis of coding techniques used in the software, relative to popular or best practices
  8. Commentary on any potential security issues we notice (although as a company we do not specialize in security analysis)
  9. Assessment of the user interface
  10. Assessment of the overall amount of functionality relative to the quantity of source code
  11. Overall assessment of the maintainability and future prospects of the code

Of course the specific outline varies from one analysis to another, and we often have special requests from a customer to look in particular depth at one area or another.

Schedule and Cost

Depending on the size of a project, the duration can vary from days to weeks, and the cost can also vary widely. We generally can quote a price, once we know some statistics about a project, and discuss the project with someone who is familiar with the code.

For example, on a project that uses AngularJS, we would inquire about:

  • How many Javascript files?
  • How many total lines of JavaScript code? Ideally the tool used to count this would skip blank lines and comment lines. For both this line count in the file counts, it is best to count only project code – sometimes these numbers can get artificially inflated by third-party code you are merely using which happens to sit in a library directory in your project.
  • How many template files?
  • How many total lines of template?
  • How many angular directives?
  • How many angular components?
  • How many angular services?
  • How many different third-party JavaScript “widgets” are used?
  • Mention any major add-on libraries that the application uses extensively; for example Lodash.
  • Subjectively, how many distinct screens/pages are there in the sites/applications? Is there a large amount of code driving a small number of complex pages?

Sounds good, how do I buy this?

This is just a blog post, but if you contact us we can discuss your particular project in need of analysis, get a sense of its size, and prepare a service agreement to begin.

Bits are Free, People are Valuable

A few days ago, I caught myself thinking about whether to save some images and video; whether the likely future value of those megabytes would be greater or lesser than the cost of storage. This is a sort of thought that was important and valuable… a couple of decades ago.

Bits are Free

Today, and at least for the last decade, bits are so absurdly cheap that they can be considered free, compared to the time and energy of people. Storing gigabytes or terabytes because they might come in handy is not just for government agencies, it makes sense for all of us in our daily work.

Waste bits to save time.

Waste bits to help people.

People matter, bits are free.

Bits are Free at Work

Here are some ways I waste bits at work:

  • We often gather a few people working on project to meet or code together; it is very easy to start a video or screen video recording of the work. That recording can then be shared with anyone on the project who wasn’t present.
  • We record screenshots or videos of the future in progress, and send it to a customer. Yes, we could wait and present to them “live” using WebEx or whatever. But it is cheaper to waste the bits and conserve human coordination effort.
  • If I have something complex to explain to someone, I can do it in person, and I can do it on the phone, and I can write lots of text. But if I already know them well enough to partly anticipate their questions, I will start a video recording and explain something using voice and white board. The bits are cheaper than the coordination to work “live”. The bits are cheaper than asking them to figure it out themselves.
  • Driving down the road, it is unsafe to text, or read, or write, or (I am looking at you, morning commuters…) apply makeup. But while the numbers are unclear, we have a broad assumption that merely talking with someone while driving down the road is OK. I sometimes make use of traffic time, and burn some bits, by recording audio about some problem to be solved or other matter. The bits are free, who cares if this uses 1000x as much data as sending an email?

Wasting bits can grow somewhat extreme. In the first example above, I described a screen video of developers working together, recorded for the benefit from other developers. You might imagine this as a high-ceremony process, done on important occasions about important code. But bits are free – so we sometimes record such video even if no developer will ever pay attention to it – the value is there even if just one developer maybe lets it play in the background while they work on something else – much like by working in the same room as other people, it is common to pick up some important bit in the background. If one developer learns one small thing to make their work better, that is more valuable than 400 MB of video storage space.

Bits are freeBits are Free at Home

Here are some ways I waste bits at home:

  • When I take photographs, I take a lot of photographs. One might come in handy. Who cares if 95% of them are bad and 90% of them are useless?
  • Why do cameras have settings other than maximum resolution? Bits are free.
  • Nearly 100% of paperwork I get in the mail, other than marketing, I scan, OCR, and keep in a searchable archive. The disk space for this costs almost nothing. The time saved deciding whether to keep each item, and how to file each item, is irreplaceable. I probably only ever look at 10% of what is scanned, but who cares?
  • If my kids are doing something even vaguely interesting, I try hard to remember to take photos and record video. Looking back at when they were very young, snippets of video we have (from before every phone had a decent video camera) are priceless. I can’t reach back and record more of those, but I can easily record things now that might be fun in the future. Who cares if 95% of that video no-one ever looks at? If I ever need to go through it, I can do it then. The storage space in the meantime doesn’t matter.
  • If I need to look at a model number, serial number, etc. of anything around the house, I snap a photo of it. Then I can look back at the photo anytime from anywhere. Yes, it is absurd to store 3,000,000,000 bytes of JPG rather than 20 bytes of serial number. But they both round to zero.

How Free Can Bits Get?

I expect this tradeoff will shift even more exponentially in the future. In a couple of decades, perhaps:

  • We will record 5 petabyte ultra beyond-HD holographic recordings of insignificant activities just in case someone wants to watch them.
  • We will run video and audio recording of our lives 24 x 7, to be indexed just in case anyone ever wants to look back at it.
  • Future cameras won’t even come with an on-off switch, and will instead record continuously for the lifetime of the camera.


RE: Design/UXD Conference Day 2, San Jose 2013

Day 2 in San Jose, and I need to give the same disclaimer as yesterday.

“You can find more information at the conference website (http://www.redesignconference.com/). I will run through the sessions and attempt to communicate those points I found especially poignant. Much of this will be iterative, in that the presenter had a point, I may have heard it as they intended it or applied my own analysis to it. Either way, I should qualify that all of these ideas are not mine but at the same time many of these ideas were not the presenters’. That should be clear as mud!”

What We Can Learn from Disruptors – Carrie Whitehead – Zappos

What We Can Learn from Maps – Eric Rodenbeck – Stamen Design

What We Can Learn from a Voter – Adam Stalker/Daniel Ryan – Obama for America

What We Can Learn from Gaming – Christina Wodtke – Publisher, Boxes and Arrows

The Experiential Difference – Jesse McMillin – Virgin America

conf_uxdThe story of Netflix and Blockbuster are a cautionary tale for any business. 5 years ago Blockbuster was in excellent financial position, expanding markets, a solid business. The markets and Blockbuster scoffed at the upstart Netflix and its business model. The truth was, complacency had invaded Blockbuster and today they are bankrupt while Netflix, despite missteps, is growing and positioned well for the future. The moral of the story is incremental improvements to business are important and powerful but CANNOT substitute for innovation. We need to look ahead, see patterns, see opportunities, and innovate.

We need to design for one task to touch many channels. Retailers like Amazon have to consider this. Users might browse on a tablet, phone, pc or tv. They might review products on the tablet and complete orders on the pc. They might manage gift lists from their phones or make media purchases there through apps. They might stream movies on their accounts from their TVs. All of these are part of a single task arriving from multiple touch points.

Quick technology geeked out moment and an example of good design: I am editing this post on my Chromebook Pixel. I have my notes open in Evernote in a window to the left of my editor. I can scroll in the Evernote window by placing the mouse over the background window and moving two fingers on the touchpad. I can do this without changing focus from my editor. I can scroll in Evernote while typing in my blog editor. Excellent design!

bigstock-Infographic-elementsMapping data sets is both an old discipline and one that in many ways is brand new. Over the millenia maps have been key to many things. They told stories about the land they described. Cartography is collected as a highly prized art form. Maps today have been reduced to a simple tool. Very little depth is present. Sure, you can make it look different with the treasure map layer on Google, but there is not a story there.

When we consider data in various systems we can choose to look at the numbers in tabular format or visualize data in graphs, charts or tools. If we take this a bit further and “map” the data in multiple dimensions, unusual patterns are visible, new questions are raised, and a greater understanding of the data is possible. The human interface for interacting and exploring this data still needs to be developed. Hollywood has its ideas, and we all know how realistic that is. It is clear that we are very close to being able to tap into historical data at a level that was impossible previously.

When we do map data there is an opportunity to return to the storytelling of mapmakers of old. We can intentionally weave a manager’s job description in how the data is presented and manipulated. We can provide the “rest of the story” to a busy executive wondering how effective his workforce is many levels of management isolated from him. We can empower users with predictive inputs to help them make wise decisions in their businesses.

Big data no longer means collecting snapshots, it means collecting everything. The election in 2013 was an unprecedented opportunity to both track and influence social networks. The Obama campaign partnered tightly with Facebook and Google to provide daily inputs that directed the campaign. Every night 66k election simulations were run and analyzed, data was constantly challenged and tested, and changes in strategy were implemented. They had deep access to millions of voters’ data, during an emotional election season, with a crescendo of activity culminating in the election. What a researcher’s dream.

One use of social media was really surprising to me. The campaign had a list of undecided voters. They mapped those voters on Facebook in many ways. What photos were they tagged in? Who were they friends with? Who did they share with? Where did they live? Then they would measure the influence of their supporters with those voters using the same metrics, and score the “influence factor” of that supporter. Then they would send messages from the campaign giving supporters instructions regarding who to talk to. By this method and the election day vote efforts they estimate they swung 5 million voters nationwide. This is greater than the margin of public vote victory for the president.

American politicsTwo other efforts, “The Life of Julia” and the explanation of Obamacare were both very successful. On both of these initiatives 75% of the users stuck through the application all the way to the end. This is a very high retention rate. The Obamacare app moved people through the legislation from 4 different inputs, through 500 paths, to 8 conclusions. Both of these applications flowed against the resistance we have to clicks in design.

One last conclusion from the campaign discussion was the way they drew people into donating. The entrance page for donations was very simple, the user simply selected an amount. There was much information that needed to be filled out but the user was not presented with this until they decided to give. The user rarely backed out once they made that decision. They found this far more effective than the past approach of presenting users with forms prior to the donation moment.

Game designers identify user types when building a game. These consist of killers, achievers, socialites and explorers. Another list is expressers, competitors, explorers, and collaborators. There are similar patterns at play in a business when interacting with their enterprise applications. Executives, managers, workers, and administrators all have similarities in both personality and job description to these categories. If we map both personality and job against a category of user we can learn something about how to build an interface suitable for their use. It appears there is fertile ground in this area that could yield increased productivity.

In a media-cluttered world we crave things both immersive and memorable. We need to remember that when building systems. We cannot incorporate whimsy and humor in everything we do, but there will be opportunities to do so. Our users and clients will thank us if we do.

Now that I am through the conference I feel like I can put down the firehose and absorb this information. What a valuable experience, and a conference I would highly recommend.

RE: Design/UXD Conference Day 1, San Jose 2013

conf_uxdI am attending a two day conference focused on User Experience Design. At the end of the first day I can clearly say this was a valuable event even if every presenter tomorrow is really awful. You can find more information at the conference website (http://www.redesignconference.com/). I will run through the sessions and attempt to communicate those points I found especially poignant. Much of this will be iterative, in that the presenter had a point, I may have heard it as they intended it or applied my own analysis to it. Either way, I should qualify that all of these ideas are not mine but at the same time many of these ideas were not the presenters’. That should be clear as mud!

What Can Experience Designers Learn From Rock Stars – Tim Richards (@nanotim) – Blitz

Graphic Design and Branding – Andy Gilliland – Punchcut

What We Can Learn From Connected Objects Around Us – Jeff Devries – Motorola Mobility

Learning From James Bond, Experience Designer – Danny Sill – IDEO

What We Can Learn From a Bad Remodel – Steve Tatham – Disney Imagineering

Reframing UX Design as a Profession – Peter Merholz (@peterme) – Groupon

The discussion of group dynamics was very timely as I look at the development of my teams at Oasis Digital. We need to be able to work collaboratively and we need to work solo. A big challenge has been having that solo work fit back into the collaborative effort. We need a shared language to be consistent. Each team member learns to communicate within the team but continues to use that shared language when they work alone. If we push to stay consistent, then individuals can innovate within the language of the team.

We also discussed the need to have the core message down cold. When you know it inside and out then true passion and innovation can shine through. The best musicians will play a piece thousands of times so that they know it completely. That way when they perform they can meet the audience at the experiential level and communicate without worrying about the content. We should know our process and our message without hesitation. If we do that then we can meet our customers where they are and provide them with more valuable service.flow

We also need to guard against doing it ourselves. Those around us cannot learn if we do not teach them. This is difficult when faced with deadlines and requirements, but if adhered to then the benefits are substantial. In a modern organization we need to be flexible with the parts we play. There are no menial tasks or work that is below us, there is the team and a goal. The team members have a responsibility to all push toward the goal together.

When presenting an idea we need to speak with passion and honesty, we should not apologize for limitations. We need to put our thoughts and ideas out to the world. Good design has persuasive power and we need to master our craft.

There was also discussion about the need to separate the idea from the execution. I like the quote “save yourself from yourself”. Often we can be our own worst enemy and destroy our own ideas. We load them down with requirements and additional ideas which can lead to a loss of the original point. We should iterate on the execution (how the idea is realized), not on the idea itself.

Simple is often the best approach once the shared language of the team is established. You should be able to distill core ideas to fit on a bumper sticker. This is not sales, it is communication. This flows into another point that was made which was we should design for behavior instead of designing for information. The ways users are interfacing with information are distributed across platforms and devices. We should be looking at the behavior in each context.

When a music artist wants the audience to “go nuts” they “drop the bass”. This is a universal message that invites the audience to participate. You can hear this principle in much of the music played during warmups at sporting events. A lot of dance music will make heavy use of this idea as well. As designers we should “drop the bass” in our systems. No, we should not incorporate Dubstep into our designs, we should invite users to use our software. We can do this through emphasis, colors, and simplicity.

The merger of structural thinking and visual aesthetics is very important. We need to give content form and order. There is currently a convergence of physical spaces and screen spaces. A convergence of physical and electronic devices. We should start designing using good design principles and stop just putting the logo in the upper left.

Other design disciplines can teach us a lot. Industrial and Automotive design can teach us about feedback, the prioritization of information and sightless interaction. Landscape architecture can teach us about designing for space, considering flow and managing multiple user interactions. These are very important as we bridge the physical and the virtual. We can use these ideas to develop a consistent design experience that transcends interface options.

The way we store masses of information has changed the way we think and process. The way we use all of this input and store it outside of ourselves is a phenomenal change and we are only scratching the surface of its implications. We need to consider this change as we design a UI. Users today simply interact with applications differently than they did 5, 10 or 20 years ago. We will not be going back so we need to look forward.

We need to think from a systems perspective. We can learn a lot from systems that work (subways, ecosystems, beehives). We should not try to reproduce the same experience on different devices. We should make the experience make sense in the context of the use. This context changes between travel, home and work. There is a progression of interactions that is changing over time (keyboard/mouse > touch/voice > gestures/eye-gaze). These changes are additive, because we now use voice does not mean we stop using a touchpad or mouse.

Society keeps swinging between many devices and a singular multipurpose device. Not too long ago we all had phones, mp3 players, gps devices, etc. Now most adults have a smartphone and none of the rest. With the advent of the new physical devices (fitness tracker, smart watch, Google Glass) will these collapse into a singular device or will they have enough value on their own to persist?

Reverse mentoring can be powerful. Today, youth are coming in with skills and understanding that surpass those with experience in some very critical and narrow areas. Much like teachers had to move from being the knowledge experts in schools to guiding exploration by students we need to empower young coworkers to share what comes so natural to them. We need to adopt that role of guide to help them where they need it (most functional aspects of life), and not be threatened by their skills.

All developers should be concerned with the user experience. This is not the domain of an isolated team member. There is a shortage of designers so companies tend to use their design capacity for product execution and forget ideation and product definition. A good UX designer becomes a conductor and leader for the team. It is very easy for a team to get off the “good” path.