Oasis Digital developer hiring process

Candidates keep asking: what is the process to be hired at Oasis Digital as a software developer?

Our process is solid, realistic, and strikes a good balance between speed and depth. Yet merely knowing what the process is, isn’t much competitive advantage, there’s no reason to keep it secret. Good results flow from the execution, not the checklist.

As of 2018, here is the typical Oasis Digital hiring “workflow”; sometimes it varies for special cases, people with whom we already have a substantial connection. It’s best to think of this as a kind of “funnel”. At each stage, we are looking for signs that the candidate would perform well and be great addition to our team – and trying to show strong candidates that we offer them an opportunity to thrive.

  1. Initial contact or awareness. Perhaps they see a job post somewhere, or someone refers them to us. Ideally they have a chance to watch a short video about the job and about working at Oasis Digital.  Usually we receive a resume (via a tracking system, like everyone else – so that we don’t lose track of any). Of those, some catch our eye. Those move on to…
  2. We have an initial, short conversation/interview about the candidate’s experience, current situation, what they’re looking for in their next job, qualifications, etc. We have this conversations over a video chat, to provide the candidate the maximum “bandwidth” opportunity to make a good impression about these things. A portion of the candidates move on to…
  3. A longer discussion. This discussion again is ideally over a video chat, and often involves more than one of us at Oasis Digital. If the candidate already happens to be in St. Louis, sometimes we meet in our office or over lunch; but video chat is actually “good enough” even for local candidates, and that sometimes can be scheduled more easily or promptly. Of these candidates, a portion move on to…
  4. Our real interview with a software development candidate is to spend time coding together. Ideally this is in-person in our office; although for an out-of-town candidate it’s possible to do this over a screen sharing session. We try to spend at least an hour on this, sometimes several. Working on some code together is by far the most effective way to understand where a candidate is in their development mastery. It is much more effective, and faster, than the sort of “take-home sample programming assignment” that has become popular in recent years. If this goes well and we are favorably impressed, a candidate might move on to…
  5. A deeper, more traditional “HR style” interview, where we talk about the candidate’s experiences, strengths, weaknesses, goals, and so on in depth. Will the person  the person strengthen our team, and reinforce our values? Are our benefits and compensation attractive? Can an agreeable salary be worked out? If all that goes well, the final stage is…
  6. There is a background check process; our customers often require that developers with access to their materials have a clean background check. Assuming nothing negative pops up…
  7. Successful hire – onboarding begins.

From writing all that, wow, it sounds like a lot! In the best case, it can be executed in a few days of elapsed time, although usually there is not such a rush. Our process is intended to be a less onerous time commitment for everyone involved – yet still provide ample opportunity to get to know each other – compared to what some larger companies go through.

Update (2021):

For many positions we’ve streamlined and improved even further from the 2018 description above. Our process focuses on seeing candidates in action. We hire on demonstrable technical proficiency or potential, not on the ability to endure lengthy traditional interview questioning. The process:

  • Job post and informational video provide candidates information before interviewing.
  • Interview 1: discuss some code, and the candidate codes a bit. 30 minutes or less.
  • Interview 2: discuss more code, candidate codes more. Discuss the job more. 30-45 minutes.
  • For some roles or candidates, additional interviews are needed.
  • Offer, hire, start.
  • Onboarding, learning boost, and mentorship process begins.

(Of course there is variance on the length and use of the interviews, depending on details of each position.)

Angular Boot Camp Unleashed

Oasis Digital is pleased to announce that…

we are publishing extensive example code that we use in Angular Boot Camp. This example code is available under an open source license (in case you want to grab a bit to use in a project), and is hosted on GitHub for easy browsing and instant editing on StackBlitz:

https://github.com/AngularBootCamp/abc

We’ve published 49 examples so far, with more coming. Why are we publishing this?

  • For students to peruse before class, to better understand what we teach.
  • For students to review after class, as a reminder of what they learned, and to grab code snippets.
  • To provide working, up to date, concise examples of Angular concepts for anyone in the community who needs them.

Here’s a one minute video showing just how easy it is to browse the examples, run them, and view/edit the code:

We have some FAQs also. If you are interested in learning Angular deeply, please consider our class, Angular Boot Camp.

Printable reports in a Node application

Imagine your shiny new web application, JavaScript from end to end (perhaps Node plus Angular/React/Vue/etc) offers a great set of features and a highly interactive user interface. Then a key decision-maker wanders by to praise the interactive features and ask where they click to obtain detailed printable reports like those generated by all the predecessor systems for the last few decades. Uhoh.

It turns out that report still matter, sometimes they land on paper, other times just as PDF files easily passed around without access to the original application. Here are our thoughts on how to effectively generate reports from a Node application. There are many options, but these are what we most commonly see and use.

1: Print the relevant application page

By far the simplest way to get a “report” from a web application is to use the browser’s built-in print capability. To “print a report”, the user navigates to where they see the data they wish to print, then they choose print in the browser. That’s it.

Many pages yield a somewhat poor report from that output by default, but a CSS media-query print stylesheet can rearrange things enough to produce passable results for simple cases. We recommend setting up such print stylesheets, and trying to print pages that have a report like nature, even if another reporting technique is also used – the ability to print a web page has been in browsers since nearly the beginning, and offers a low-cost way to get more value from the same application.

2: Headless-browser-based reporting

Printing an application page in the browser means being limited to whatever HTML is relevant to display in the browser, and further being subject to the vagaries of different browsers. Instead, it’s possible to reuse the same tools (HTML, templating, CSS) on the server to generate specific content for report printing.

To do this, choose any of the highly numerous node HTML templating systems, perform data access however you do so for application features, gather up the data for report, and emit the HTML/CSS. Then use a headless browser (on the server) to transform that HTML and CSS to a PDF, then make it available for the user to download.

This has some compelling advantages:

  • Familiar programming model – as a developer you use approximately the same tools for report output that you use for screen output
  • As a result, it’s easy to get started with relatively little to learn
  • Well suited to reports that generally feel like “documents”, such as dunning letter reports.

Disadvantages:

  • HTML, and therefore this approach, have little in the way of traditional reporting software features
  • Layout tooling for HTML is screen oriented, not report oriented

Implementations include:

3: Reporting library / API

There are Node libraries which offer an API generally suitable to create reports. Unlike the HTML approach, a reporting centric API will have features directly suited for report output, such as creating tabular data output aligned by decimal point, looping over data to put rows in such a table, and so on. This typically will be considerably more concise than HTML approach, because the API will be closer to the problem domain (the domain of “make a report”).

A notable disadvantage here is that the vocabulary of report such an API can produce tends to be much more limited. This is inherent in abstraction, the higher level an API, the easier it is to produce results, but the more constrained the results.

Implementations include:

4: Low-level PDF drawing API

Rather than a high-level API, and there are also low-level APIs available to programmatically create PDF files. A low-level API will have operations like “place text on the page with the following formatting” and “draw a line from coordinate to coordinate”. This low-level, full control means that any report or other output can be produced, but the coding effort to do so can be significant.

This approach typically makes sense only for cases with very specific reporting needs. It is too labor-intensive to create numerous reports this way.

Implementations include:

5: Call a traditional report tool

Lastly, reporting can be thought of as a separate subsystem, whose implementation need not be bound into the same platform as the rest of a system. With this approach, reporting functionality is generally omitted from the application backend, and instead implemented using an off-the-shelf report tool. There is a busy “enterprise” reporting tool market, with multiple very mature products. Costs vary widely, but these tools provide the kind of reporting experience developers may remember from years past: a visual report design surface, a way of interactively running and tweaking and drilling into a report, and so on.

Advantages:

  • Extensive layout possibilities
  • Visual layout tools, rather than code only
  • Report design can often be done by non-developers
  • The reporting solution may offer tools for managing and customizing a large library of reports, out-of-the-box

Disadvantages:

  • Separate subsystem, different tool for staff to learn
  • Deployment complexity, of deploying an additional product rather than only adding a library
  • Cost: some of these are very “enterprise” products, with prices to match

Implementations include:

Choosing an approach

The general trade-off among these approaches is that both cost and capability increase in roughly the order presented above. An acceptable CSS print-specific-stylesheet might yield acceptable results in a few minutes; a separate reporting subsystem, with a new tool stack to learn, could involve a team laboring for months. Oasis Digital has used each approach above (except the headless broader approach, as headless browsers just recently became popular) with excellent results.

Loopback 3, TypeScript, and Custom Connectors

Loopback is a powerful Node.js API framework built on top of Express that comes with a lot of functionality in-the-box. Recently, I gave a talk about creating APIs with Loopback in the context of building Angular web apps. In that talk I created a vanilla Loopback API using the Loopback CLI and connected the resulting API to the Angular Tour of Heroes demo application. While the CLI allows for easy configuration of Loopback’s JSON files via simple command-line operations, there are times when you need to write code to expand the functionality of your API, especially when the backing storage is not an off-the-shelf database but a custom enterprise API. In cases like this, the best solution is often to write your own connector. Also, many developers would like to use TypeScript with Loopback. While Loopback 4 will use TypeScript by default, version 4 has not yet been released. Although Loopback 3 does not use TypeScript, any Loopback 3 project can be converted to use TypeScript today. In this article I will explain how to convert any Loopback 3 project to TypeScript and also how you can expand your API’s capabilities by creating your own connector.

Background and Motivation

TypeScript

By default, Loopback projects are configured with JSON files and coded in JavaScript by default. While motivating TypeScript over JavaScript is beyond the scope of this post, there are many persuasive arguments for using types as a first line of defense against bugs. As a first-order approximation, TypeScript is merely typed JavaScript, and TypeScript readily transpiles into JavaScript. Thus, as we will see, TypeScript can afford type safety in any Loopback project with minimal headache.

Architecture of Loopback

Briefly, Loopback represents groups of data abstractly as models that interact with backing storage via connectors. Incidentally, a configured instance of a connector is called a data source. In Loopback, a model represents the schema of one instance of a certain kind of data, and a connector enables any number of models to interact with backing storage. There are many connectors available, such as MongoDB, MySQL, and PostgreSQL, which are installed as NPM packages.

The idea behind this separation of concerns is that you can describe the shapes of – and relationships between – your data separately from describing how to retrieve or update that data. For instance, if one were building an API to represent a hospital, a “physician” model could be created that contains properties such as specialty, years practiced, and gender, and a separate “patient” model containing, for example, properties for a patient’s age, gender, address, and phone number. Then, each model could be connected to backing storage via a connector.

Furthermore, the connector does not have to be the same for each model: physicians could be stored on a MySQL database and patients stored on a MongoDB instance, for example. The relationship between each patient and a physician can then be handled fully inside Loopback by constructing what are called relations.

For more information about the architecture and typical usage of Loopback, see my Loopback talk.

Loopback Connectors

Since Loopback has many connectors available as npm packages for different kinds of storage, the model-connector architecture works very well when the backing storage is an off-the-shelf instance of, for example, Postgres, MongoDB, or even Elasticsearch. However, when your model must interact with a custom API, you are largely left with the following three options:

  1. Use the Loopback REST connector
  2. Write custom code directly inside the model
  3. Create a custom connector

The first option only works if the API is sufficiently RESTful, and the second results in code that is not shared between models. Thus, the best way to enable your Loopback API to interact with non-RESTful APIs is often to write your own connector.

When Should TypeScript be Compiled?

When converting a JavaScript project to TypeScript, one can generally choose to either run the project in ts-node – the TypeScript version of Node – or compile the project with the TypeScript compiler and run the resulting JavaScript output with the standard version of Node. Although the ts-node option avoids the need to explicitly compile each time the source code is changed during development, it also implies using ts-node in production, which we generally avoid in favor of Node itself.

Thus, I will assume that our goal is to compile from TypeScript source rather than running the TypeScript project in-place. The end result will be a server directory containing TypeScript source files and JSON configuration files, and a build directory that contains the compiled JavaScript files along with the same JSON configuration files. To do this, we will use the TypeScript compiler and an npm CLI utility to copy Loopback’s configuration files to the build directory.

Unfortunately the Loopback CLI will not work on the TypeScript project. However, the CLI can still be useful by performing actions on a test Loopback project, checking how the changes affected the JSON configuration files, and performing the same changes on the TypeScript project by hand. We have found that, after using Loopback enough, it can be faster to perform actions, such as creating models, by hand rather than using the CLI.

Converting a Loopback Project to TypeScript

When creating a new project with the Loopback CLI, a JavaScript project is created by default. These steps assume the project is a fresh CLI-generated project, however the general approach applies to any Loopback project.

To convert a Loopback CLI-generated project to TypeScript, we can take the following steps:

1. Create a ‘build’ directory in the Loopback project’s root level for the output JS and JSON files
2. Run ‘npm i –save-dev typescript’ in the project to install TypeScript as a development dependency
3. Create a ‘tsconfig.json’ file in the root level with “outDir” set to “build/server” and “include” containing an entry “server/**/*.ts.” An example ‘tsconfig.json’ file:

{
"compilerOptions": {
    "target": "es6",
    "module": "commonjs",
    "noUnusedLocals": true,
    "noUnusedParameters": true,
    "outDir": "build/server",
    "sourceMap": true,
    "noImplicitAny": true
  },
"include": [
    "server/**/*.ts"
  ]
}

Example tsconfig.json file

4. Run ‘npm i –save-dev @types/node’ to install the TypeScript types for Node.js
5. Rename all .js files to .ts and fill in types. As a tip, setting “module.exports = value” in TypeScript can be achieved with “export = value”.

export = function enableAuthentication(server: any) {
  // enable authentication
  server.enableAuth();
};

Example of converting a Loopback source file to TypeScript

6. Run ‘npm i –save-dev copyfiles’ which installs an npm CLI utility that copies files
7. In ‘package.json’:

  1. Edit “main” to point to “build/server/server.js”
  2. Add a “compile” script that performs “tsc && copyfiles \”server/**/*.json\” build/server -u 1” to copy the JSON configuration files and preserve the directory structure

8. Run ‘npm start’ to start your API server!

{
  "name": "loopback_ts",
  "version": "1.0.0"
  "main": "build/server/server.js"
  "engines": {
    "node": ">=4"
  },
  "scripts": {
    "lint": "eslint .",
    "start": "node .",
    "compile": "tsc && copyfiles \"server/**/*.json\" build/server -u 1",
    "posttest": "npm run lint && nsp check"
  },
...

The resulting package.json file after starting with a blank CLI project

build
  server
    boot
    component-config.json
    config.json
    datasources.json
    middleware.development.json
    middleware.json
    model-config.json
    server.js
    server.js.map
node_modules
server
...

The resulting directory structure after converting to TypeScript

Now the project has been converted to TypeScript! Next steps include:

  1. Configuring linting
  2. Adding a “clean” script to clean the build directory using, for example, rimraf or rimraf-standalone for “rm -rf” cross-platform compatibility, and
  3. Setting up a directory for the client application to live in

These are left as an exercise for the reader or a follow-up article.

Writing and Using a Custom Connector

Using an existing connector generally involves installing the connector with “npm install,” adding the connector as a data source (either by hand in the JSON or via the Loopback CLI), and using the data source with a model (again, either by hand or via the CLI). This works because Loopback looks for connectors in the node_modules directory, where npm packages are installed. Thus, there are generally two ways to incorporate a custom connector into a Loopback project: publish your connector with the prefix “loopback-connector-” in the name as a repository, for example on GitHub, and install it with “npm install,” or place the code inside your Loopback project and use a JavaScript hook to instantiate the connector as a datasource in code. Here we describe the latter option since in general we would not like to have to publish every custom connector that we write.

The following two code snippets show the boilerplate TypeScript code that is required to create a new, custom model and connect the connector to a model. In the connector code, when Loopback creates a new Data Source from a connector, it calls the connector’s exported “initialize” function by passing a Data Source object and a callback function. The initialize function creates a new instance of the connector and initializes pointers in the Data Source and connector objects to point to each other. The constructor of the connector initializes any properties of the Data Source that were passed as properties when the Data Source was created.

export class MyConnector {
  dataSource: any;
  propertyName: string;

  constructor(settings: any) {
    // Initialize properties here:
    this.propertyName = settings.properties.propertyName;
  }

  // Implement connector methods here (see Table 1)
}

export function initialize(dataSource: any, callback: Function) {
  const connector = new MyConnector(dataSource.settings);

  dataSource.connector = connector;
  connector.dataSource = dataSource;

  callback();
}

Boilerplate code for a custom connector

import * as loopback from 'loopback';

import * as MyConnector from 'path/to/the/connector';

const myDataSource = (loopback as any).createDataSource('dataSourceName', {
  connector: MyConnector,
  properties: {
    propertyName: 'Hello, World!'
  }
});

export = function (myModel: any) {

  // Connect model to data source
  myModel.attachTo(myDataSource);

};

How to use the JavaScript “createDataSource” hook to connect a custom connector to a PersistedModel

Supporting PersistedModel in the Connector

After creating the boilerplate code, the logic of the connector must be implemented as methods in the connector’s class. Since the most common use case of Loopback models is the PersistedModel, which generally represents any model that is persisted in a backing data storage, we focus on using custom connectors with a model that declares PersistedModel as its base class.

As the Loopback documentation explains, the PersistedModel is the base class for most built-in models, and the vast majority of Loopback model use-cases rely on the PersistedModel as a base class. The PersistedModel provides standard create, read, update, and delete (CRUD) operations and exposes REST endpoints for them. Since we are creating a custom connector, the connector must implement methods that the PersistedModel’s CRUD operations use.

After the Data Source is attached to the PersistedModel, specific methods in the connector are called to create, retrieve, update, or delete data based on the source PersistedModel endpoint. Table 1 shows which connector methods are called for which PersistedModel endpoints. As we can see, only a few connector methods support a wide variety of endpoints.

PersistedModel Endpoints Connector Method(s) Called
PATCH /modelName
PUT /modelName
POST /modelName
POST /modelName/replaceOrCreate
create
GET /modelName
PATCH /modelName/{id}
GET /modelName/{id}
GET /modelName/findOne
all
HEAD /modelName/{id}
GET /modelName/{id}/exists
GET /modelName/count
count
PUT /modelName/{id}
POST /modelName/{id}/replace
replaceById
DELETE /modelName/{id} destroyAll
POST /modelName/update update
POST /modelName/upsertWithWhere all
create

Table 1: Connector methods that must be implemented to support the given PersistedModel endpoints

To implement the connector methods, the parameters of these methods must be discovered. This is left as an exercise for the reader, however an easy way is to declare several parameters, log them to the console, call the associated endpoint(s), and observe the console output. In general, data is passed first, followed by an authorization object and a callback function.

Disabling Remote Methods

Finally, if any PersistedModel endpoints are not needed, they can be disabled using “disableRemoteMethodByName” as shown in the code snippet below. This particular snippet disables all but the immutable endpoints of a PersistedModel. The only caveat to using this JavaScript hook is that any endpoints that are not static methods of the model’s class belong to the model’s prototype and must be declared as such with “prototype.methodName”.

export = function (myModel: any) {

  // Connect model to data source
  myModel.attachTo(myDataSource);

  // Disable mutable and unimplemented endpoints
  myModel.disableRemoteMethodByName('createChangeStream');
  myModel.disableRemoteMethodByName('upsert');
  myModel.disableRemoteMethodByName('updateAll');
  myModel.disableRemoteMethodByName('upsertWithWhere');
  myModel.disableRemoteMethodByName('create');
  myModel.disableRemoteMethodByName('replaceOrCreate');
  myModel.disableRemoteMethodByName('replaceById');
  myModel.disableRemoteMethodByName('deleteById');
  myModel.disableRemoteMethodByName('count');
  myModel.disableRemoteMethodByName('prototype.updateAttributes');

};

Disabling some of the endpoints that come with a PersistedModel in-the-box. This snippet disables all but the immutable endpoints.

Conclusion

Although Loopback 4 will use TypeScript natively, it has not been released at the time of writing this article, and many would like to use TypeScript with Loopback 3 today. While Loopback 3 makes it very easy to create APIs based on off-the-shelf databases via JavaScript and connectors that are available as NPM packages, it is typically not clear how to convert a Loopback 3 project to TypeScript or create custom, unpublished connectors that will only be used within local projects. As we have seen, it is indeed possible to convert a Loopback CLI project to TypeScript, create a custom connector locally, and attach this connector to a PersistedModel. After copying short bits of boilerplate, only 6 methods have to be implemented to support 16 endpoints. Finally, since a connector can then be reused across many models, a sufficiently general connector can be reused within one project or across many projects.

Software Product Quality at Oasis Digital

A long-studied topic

Decades ago, business guru Philip Crosby famously defined quality as “conformance to requirements”. This definition seems useful in software development only to the extent every aspect of the software has been comprehensively understood and written down – rarely the case in real projects.

Fewer decades ago, software and consulting guru Gerald Weinberg slightly less famously wrote that “Quality is value to some person” – an insight more applicable to our context here at Oasis Digital, consultants and developers of custom software products. (Incidentally, to gain dense insight into software development and other topics in well-written tidy packages, read Weinberg’s books.)

Still, to point out that quality is whatever someone (typically a paying customer) says it is, doesn’t help all that much with a problem we face regularly.

I want a high quality software product, but what does that mean?

At Oasis Digital, customers often come to us with a vision, or partial written requirements, for a software product or system. Around this essential kernel, there are numerous possibly-implied desires or requirements, many related to quality.

What should an organization (or person) want, if they generally want a good, high quality product? We think of the answer to this as the implied requirements for high-quality software.Recently the team here started gathering a list of quality attributes (special thanks to Paul Spears for kicking this off on a whiteboard for all to see). Here is our checklist of desirable attributes, requirements, meta-requirements, and other aspects of quality or otherwise “good” software.

Quality checklist

The software we work on most often has both server-side and web/tablet/mobile UI, so our checklist contains a somewhat broad mix of topic areas.

Functionality

  1. The software works “on the happy path”; it has all the specified desired features.
  2. The software handles numerous potential error conditions well; it fails gently, and visibly. It recovers, or fails clearly if it can’t.
  3. The software implements a workflow at least as friendly to users as envisioned; ideally even more so.
  4. The software augments, rather than consumes, human mental bandwidth while using it.
  5. The features are generally composable where appropriate. That is, when a pair or set of features are more valuable when used together, they can be used together and work as expected.
  6. The software conforms to legal or regulatory requirements to which the subject; achieving this often requires cooperation among developers, customer representatives, and sometimes experts in compliance. In some projects this may be a minor aspect, while in others it is a primary defining motivator.

Support and operations

  1. The software captures logs of events that go wrong (and generally also of things that go right); it does so in a manner suitable for aggregation and analysis, with generally well considered log levels, a machine-readable log format, and so on.
  2. The software has features suitable to help with support efforts; for example it shows what version of the software is in use, helpful error data is exposed (in log as well as, where possible, on screen) rather than discarded, etc.
  3. The software is operations-friendly. It has switches, features, or other attributes helpful for operations teams responsible for keeping the software working.
  4. The software does not forget facts to which it has been exposed; where technically feasible, it has an append-only, log-structured view of the world. This both supports debugging efforts and future not yet known requirements.

Appearance and behavior (UI/UX)

  1. The user interface conforms to some design system, its layout and appearance are not completely subjective and ad hoc, but follow some understood and well considered guidelines for appearance, layout, etc.
  2. Unless the software is either very large (with a large budget), or is an art piece (such as a game), it does not “go its own way” with an ad hoc design.
  3. The user interface is aesthetically pleasing, in the subjective sense. (To whom?)
  4. The user interface further has suitable animations or dynamic style behavior, suitable for its design system.
  5. The user interface is themeable; at least its colors, and possibly other aspects, can be adjusted to fit in coherently with other software that uses some defined color palette. The user interface code should therefore use appropriate color theme variables or similar mechanism, not be hardcoded to match a design system or ad hoc requests.
  6. The user interface is responsive; it makes reasonably good use of a wide range of screen sizes. It is not a fixed size for a single screen size, unless its target (embedded) deployment environment is similarly strictly limited.
  7. The user interface does not suffer the “keyhole problem”; when presenting the user with a significant amount of data, it makes good use of the display to show the user many options and useful context.  http://www.aristeia.com/TKP/draftPaper.pdf
  8. To the extent of the user interface presents data in tabular form, the tables presents numeric and text content with suitable alignment.
  9. The user interface features the variable contents (data) and more prominently than fixed labeling; a well-chosen design system generally will achieve this goal out-of-the-box.

Operating / human environment

(As of this writing, most of the software we work on has a web user interface, and that shows in this checklist.)

  1. The software supports all current browsers, and possibly (depending on target deployment environment) one or more obsolete browsers as needed.
  2. The software has good accessibility characteristics, including testing with a screen reader or similar assistive technology.
  3. The user interface visually scales well in response to user font size overrides; it does not attempt to block the user from changing the font size, and its layout remains usable across a range of font sizes.
  4. The user interface contrast levels (as supported by the design system) are high enough to pass accessibility testing.
  5. Color is used effectively to maximize the speed of comprehension; but no information is ever presented only in the form of color, so that the software remains workable for users who don’t perceive color fully.
  6. The software is reasonably compatible with its platforms internationalization capabilities; and if needed, has been (or can be) suitably localized.

Performance and throughput

  1. The software has been tested, and works acceptably, with a realistic date volume. It is often necessary to obtain or generate test data of configurable size to verify this need has been met.
  2. Performance characteristics in error handling characteristics have been considered jointly; so that an occasional error does not completely halt the throughput capabilities of the software. It is possible to move past or set aside a failure case and continue meeting throughput expectations in the case of occasional error.

Security

  1. The software is built on a platform or framework choices which have reasonably well considered security characteristics; the software cooperates with this platform in such a way to generally inherit those characteristics.

(Security could fill books, not one section of a single blog post. For a software product applied primarily to an internal, benign audience, the above is probably sufficient; but for software deployed to the open Internet, or in other cases where hostile actors are expected, appropriate much more substantial security design and implementation is needed.)

Development Process

  1. Intentionally chosen, considered process appropriate for the project
  2. Regular demos or other progress presentations to stakeholders
  3. Regular code review, before (not only after) code enters the mainline of development
  4. (of course many books could be and have been written on development process!)

Internal characteristics

It’s possible to write software which externally does everything it is required to do, but internally is a shambles. Some thinkers imagine that this is the timely and inexpensive way to create software. We have not found that to be the case. Rather, to achieve external quality without overwhelming cost, internal quality is vital. We strive to create reasonably good internal quality without being explicitly asked to do so. Internal quality characteristics often include:

  1. Consistent code style, applied automatically
  2. Linting, applied automatically
  3. Internal and cross project code reuse – general avoidance of duplication
  4. Architectural consistency across portions of a system
  5. Consistent use of suitable platform features; don’t reinvent the wheel, don’t blindly apply techniques from one platform to another

Making sense of Quality for a customer project

This list is long (and could grow much longer). Achieving these things may consume substantial time and effort. At the same time, software projects often arrive at our door already under schedule pressure. To manage this conundrum, we work with customers to consider this list as a default; a list of things that probably should be done, but which a customer might choose to skip some items for schedule or budget needs. For each aspect of quality, a certain amount of minimum attention is needed (and automatically applied by a high-quality software team), but beyond that there is a range of possibility subject to customer priority.


CSS grid with Angular and CLI – the time is now

Today, early December 2017, is the time to begin using CSS grid for layout in Angular applications, even if they must support Internet Explorer. We can stop enduring the costs and delays of old “float” based CSS layout, and get better results with less work, using CSS Grid – even with Internet Explorer support requirements – with caveats described below.

Take a look at a running example on the browser of your choice, including both modern browsers and IE11.

https://oasisdigital.github.io/cli-css-grid-demo/

Background

If you’re not familiar with CSS grid, the best source is Rachel Andrew, the global guru of CSS grid. Either read and all of her Grid content, or peruse the links below (thanks mostly to Bill Odom, our early CSS Grid cheerleader, for gathering these). Now is a good time to read and watch, I’ll wait.

Welcome back, CSS Grid fan. Of course the big problem with Grid today is that while support is excellent among current browsers, many users (especially paying, enterprise users) are still wallowing in Internet Explorer. IE has basic support for CSS Grid, but the support is for an older spec which has both fewer features and different syntax. The syntax is irritatingly different enough that manually maintaining both is prone to error.

Fortunately, the incredible Autoprefixer does a very good job, in version 7, of papering over the syntactic differences. In many cases the benefits of Grid can be obtained even without the newer semantics.

Yak shave

Unfortunately, Angular CLI (as of version 1.6.1, as I write this) uses Autoprefixer 6, and exposes no way to adjust Autoprefixer settings. This CLI issue tracker has many open issues, and it appears the team is closely focused on core application bundling and ergonomic considerations, so it’s hard to predict when CLI team attention could turn to issues like this.

Yet here at Oasis Digital, we are ready to use Grid today, and our customers are ready to deploy software today. Therefore, a series of workarounds is in order. To see them in action and in detail, visit this demo repository:

https://github.com/OasisDigital/cli-css-grid-demo

…and for an explanation, read on.

Upgrading Autoprefixer

To use version 7 in an Angular CLI app today, a way must be found to override the Autoprefixer dependency. The traditional answer to override dependencies and settings in CLI is to “eject” – but that is a big leap, not easily reversed, and not recommended. An application based on ejected CLI presents a greater maintenance burden for developers. Instead, we generally recommend sticking with CLI but applying whatever patches are needed at run time to get the right behavior.

Unfortunately as of late 2017, it is still unduly difficult to override dependencies with NPM; searches looking for the way to do it, lead in circles toward old NPM versions. Happily, Yarn can do it quite easily, as a first-class feature. Switch to Yarn, then add a section like this to the package.json file:

"resolutions": {
  "autoprefixer": "^7.2.3"
}

Turn on grid support

Next, Angular CLI does not yet provide a way to pass options to Autoprefixer, and using Grid requires turning the support on. To work past this, the venerable approach of “monkey patch in a postinstall script” solves the problem easily. The script content is essentially just:

sed -i.bak -e 's/autoprefixer()/autoprefixer({grid:true})/' \
 node_modules/@angular/cli/models/webpack-configs/styles.js

This reaches into the relevant file inside the installed CLI code, and edits it in place. I think of this as a rough but necessary hack, to deliver value today, reaching ahead to the future when the tools will make the hack unnecessary.

Fortunately, between these two workarounds there are just a few lines of edit needed in a project. Study the repository above (especially the second commit in the commit history) to see the exact changes.

Conclusion and caveats

Of course there are caveats here, explained in depth by the Rachel Andrew page I linked above. The situation is not quite as severe as that page suggests though, because of what Autoprefixer does. With this setup, you can use today’s Grid syntax, but the subset of Grid semantics supported by IE. This means:

  • Use modern grid-column definitions etc., no need for the older “span” concept.
  • No “flow” in to grid cells – assign grid locations manually. Fortunately, for application layout Flow manual assignment is common anyway.
  • No “gaps” – leave an empty track instead. Easily done.
  • No grid-template-areas.
  • As always, remember to test on IE.

While these caveats are a bit frustrating (especially the lack of grid-template-area), this use of Grid is still an enormous improvement over legacy CSS approaches for many (or most) application screen layouts. With this approach, I see no further reason to wait to start using Grid broadly in Angular applications.

Future work

If the lack of grid-template-areas proves too frustrating, I may look at a similar approach to squeeze in support for postcss-grid-kiss; it provides syntax far beyond that offered by grid-template-areas, and also provides more semantics on IE through use of greater CSS contortions.


Angular routing – advice for real applications

There are plenty of examples and documentation about the Angular router, but these things sometimes leave important questions unaddressed.  Documentation often intentionally demures from questions like “what is the best way to use this?”. Even my own previous post briefly reintroducing the router does the same.

Here are our recommendations from extensive use (at Oasis Digital, in classes and complex customer applications), with my specific take on contentious points, on that category of Routing question. How can the built-in capabilities of Angular, including the router, be used with maximum leverage? How can an application be written “with the grain” of Angular to produce the greatest value with the least code? How can the router be used to provide a good user experience and functionality?

URL/route for navigational state

The standard use of intra-application URLs is to represent and control navigational state. Navigational state means “where” the user is in the application. Which screen; which entity; what they are working on; what they are looking at. This type of state so strongly belongs in the URL that (in a polished, important application) it should always be managed via the router -even if some other state mechanism is being used to manage other aspects of application state.

Pop-ups and auxiliary routes

The Angular router has an auxiliary route feature, uncommon among other routers for other frameworks. This feature has various uses, particularly for (unusual) applications with more than one section of the screen that might be navigated separately. But it also has a common use: if an application has a pop-up/popover/dialogue of some kind (for example, a list of users in which editing a user happens on the same screen), the state of whether a pop-up is currently visible should be represented as an auxiliary route.

Resist the temptation to have a pop-up work separately from the route, because that would mean that bookmarking or sharing a URL would not capture this aspect of the user’s navigational state.

Router state and form state

Sometimes a form is used for data entry; for these cases the state of the form (particularly if you’re using model driven/reactive forms) is a fine place to keep that interim data entry state.

But in other cases, a form is used for something like a faceted search. Search parameters can easily stray into navigational state. For example, if the user is currently searching a list of orders for a certain date range that mention a certain product, they could very reasonably want to navigate forward and back to that state, they could want to bookmark and share the URL, and have those search parameters come along.

In these cases, it is reasonable to mutually interconnect the router state and the state of a form. That sounds difficult, but requires just a few lines of code. The result can easily provide a near ideal user experience around searching, URLs, the back button, bookmarks, and so on.

Router state and ngrx/Store

Ngrx/Store users have some extra tools at their disposal around the router state. There is an optional add-on package which integrates router state into Store state, so that it can be managed via the same mechanisms (actions, reducers, effects, etc. An application of significant complexity, so much so that it needs Store, almost certainly also has significant navigational state, and should strongly consider integrating them together.

Don’t fear ugly URL parameters

In simple cases, a URL contains a flat name-value pair list of optional parameters, in which the contents of such strings are most typically just a single value, it is also acceptable to pack in many values in such a single parameter by encoding a broader swath of state as JSON. For example, consider a simple search of orders in the system for order management. It might have single search parameter, perhaps which matches a product description. The URL for the state of searching for such a description could look like:

/orders/search?productMatch=blue

But for a more complex search (for example think of a faceted search with 15 different fields by which the user could search for old orders), you may need more (bug-hiding) code to shuffle search parameters into and out of URL parameters. It is also acceptable, and sometimes more advisable, to encode all of the complex search parameters like so:

/orders/search?q=...

where … Represents a URL-encoded JSON object describing the search parameters

Such a URL is less straightforward to inspect by hand, but also less work to manipulate programmatically and easier to expand to encompass more parameters. Make the trade-off at the application level, as to whether this yields a better overall system.

Router security concerns

I’ve seen suggestions of route guards is a security mechanism; but it’s important to remember that the entire browser is a user agent, it is literally an agent of the user, not the agent of the developer or of the backend system. At best a browser application can avoid making security worse, but it doesn’t actually provide security. Never assume that route guards or other client-side mechanisms are providing any real security, rather think of these mechanisms as advisory security. Advisory security is UX/UI which makes it easier for the user to avoid wandering into a screen which will break because server-side security rules interfere with its operation.

But there is a new and interesting way that browser-based applications can get things wrong with security where the router is concerned. The entire route URL, which means all route segments, parameters, outlets, etc. is untrusted user input. It could accidentally or intentionally contain errant or malicious data. Make sure to treat route data as such, sanitizing it etc. as one would any other user input.

Matrix parameters

Although not used very widely, there is a URL pattern called a matrix parameter, in which each “segment” of the URL has its own parameters rather than just one single bucket of parameters for the entire URL. The Angular router supports this nicely, by using it you can sometimes conserve application code quite significantly while still providing a more ideal user experience around navigational state captured in the URL.

Route guards for data loading

Longtime Angular users who started with AngularJS often point back to the “route resolve” feature is a critical capability they’re looking for an Angular. The Resolve feature makes it possible to delay (or cancel/fail) loading of a route until the data needed to populate the screen for the route is ready.

I recommend using this feature with caution and sparingly. Often a better user experience can be achieved by proceeding directly to a route (for example, a customer history detail display), and then asynchronously loading various parts of the data which appear on that screen. While the screen painting can be a bit messier this way, the user will perceive that the screen started loading much more quickly than if loading is delayed until all data is available. Even if the difference is only a few hundred milliseconds, showing the user partial results is typically a better default.

Angular routing, a basic Q&A

At Angular Boot Camp, we thoroughly introduce and teach the Angular router – over the course of 3 days, spread out into relevant bits and pieces of other learning. Outside of class though, customers ask a straightforward question: What is the Angular Router, and why should I care?

To answer that, this post is a tidy re-introduction to routing in Angular. It is presented in Q&A form – there is little reason to reproduce the router documentation, so this is more like the average of many conversations.

What is routing?

Most concisely, in a web application routing means the relationship between the URL and the state of the application. State can mean a lot of things, but in this context it means “what screen the user is looking at” and “what specific entity/data the user is looking at on that screen”. For example, an application might have “/orders”in the URL when they are looking at a list of orders, or “/orders/12345” when they are looking at order number 12345.

Why use a router?

Routing is about translating between this concise string in a URL, and the rest of the machinery of an application, without coding that translation “by hand”. Developers sometimes ask why they need a thing called a router to do that, whether they might just instead inspect the “window.location” variable and make the application show the right thing. In a sense, the answer is yes – you could certainly do that. But it tends to get complex as an application grows, and if you do it ad hoc, your code won’t have as much in common with other application code. By using a router, you can write less code, and have a standard off-the-shelf solution to a problem that most applications need to solve.

Why care about the URL?

As you learn Angular, you can see how to use variables and ngIfs to make different data appear on the screen in response to user clicks. For example, you could have a variable “orderScreen” and some section of your template using ngIf to display only if orderScreen==true; then have a button which sets orderScreen=true. So you can easily see how to display different data based on what the user clicks, without caring about the URL.

But URLs (and by this I mean the part after the domain name) are the standard, well proven Web way of expressing “where” the user is. Users understand URLs, and users can copy and paste URLs in email, users can bookmark URLs. If your application has a specific URL to mean “order list screen”, a user could bookmark that and navigate directly to it when they like. Fundamentally, URLs are user-friendly.

Would it be easier to just write a separate “application” for my orders list screen? Could I avoid having to understand the router by making each screen a separate application?

I’ve seen applications, especially those adapted to fit inside an server-side system, which eschew the notion of “routing” between different screens and instead have an entirely separate application for each screen. This is possible, but inefficient. The browser ends up needlessly reloading much of the same JavaScript as the user navigates from one screen to another. With the router, the user will only need to load the new, different code for the next screen as they navigate.

Similarly, the router implements “lazy loading”, so just like the idea of totally separate applications, with the router, a user doesn’t have to wait for their browser to load the “order screen” JavaScript until they are ready to use that screen.

The router provides the ideal mix of efficiency in development, efficiency and deployment.

How do I get started with the Angular router?

As you create a new application with Angular CLI, there is a routing option which sets up the basic structure of routing for you. Unfortunately as of late 2017, you still need to manually code up specific routes, which you can do by following the Angular router documentation or various tutorials online (or of course, learn in our class). I expect a future evolution of the CLI will automate more of the router configuration process.

When should I get started with the Angular router?

A few years ago, I used to recommend waiting for routing until you really need it, until your application has more than one “screen”. But now it seems more advisable to simply follow the standard patterns for routing from the very beginning. As you create your first screen in an Angular application, go ahead and implement that screen in a module, and use router lazy loading the load that one module. This seems like extra structure, but will save you from having to rearrange your application code when a second “screen” is inevitably needed down the road. This is also exactly the path we teach in Angular Boot Camp.

What about that idea of routing to a specific (for example) order, rather than to the list of orders?

The idea of routing to a specific individual entity in your application problem domain, use a route parameter. A route parameter is simply a section of a route which can be filled in at runtime with a string. For example, “/orders/12345” suggests a routing set up where the second segment of the route (12345” is a parameter. This is easily configured in your Angular routing configuration, you can see the documentation for the exact syntax.

The more interesting part of a route parameter is consuming that parameters, being aware of it from inside application code. These route parameters arrive at your application component as an observable value. You’ll need to use a small amount of RxJS code to trigger loading of the appropriate data based on that route parameter. This sounds confusing and complex, but you can find examples online would show it is often just a few lines of code.

How do I link to a route?

You can link to a Angular route in an ordinary anchor element (“<A….”) in a component template. You do this using the router link directive (attribute). The documentation shows the exact syntax, but the important thing here is simply that you link to a route within the same application, with the syntax only mildly different from linking to any other page on the Internet.

Things get slightly more complex when you want to link to a specific entity (going back to our example, “/orders/12345”). To do this you use something called a route parameter array, in which the application code snippet has an array with these two parts of the route (orders, and 12345), which then get assembled automatically by angular routing into a working route link.

Of course in real application, users often click a button to do something rather than follow an ordinary web link; you can accommodate this with routing either by styling the link to look like a button (quite easy with bootstrap, for example) or with a line of code in a click handler to ask the router to navigate to a link.

So my links could be navigation in a sidebar or top bar, right?

Yes, the most common use for router links is in a navigation bar of some kind.

In this context, it also makes sense to visually mark which route link is currently “active”. To make it obvious to the user which part of the application they have already navigated to. The Angular router also makes this quite easy with an attribute “routerLinkActive”.

Is there anything else to know about routing?

There is an abundance of important capabilities in the router beyond this quick Q&A introduction. Past this introduction though, it starts to get a little bit more philosophical, and make sense to study after you are already experienced with basic use of the Angular router.  I will follow up with another post on some of these other routing thoughts.


Software Demonstration and Project Status: Use Video

At Oasis Digital, custom software projects work at various cadences: weekly, biweekly, or sometimes in variable-length cycles. Regardless, at each interval or milestone it’s important to deliver a comprehensive demonstration and status update for our project customer.

Live demonstrations considered harmful

Unfortunately, the most obvious way to deliver demos and status updates does not work very well:

  • Perform a live, high-stakes demo – Murphy’s Law applies. Systems break during a live demo.
  • Freshly, the first time, making it up as you go along.
  • Think about project status only when asked.
  • Seen only by stakeholders who are able to attend the meeting – often a small subset of the people who care about the demonstration and status

It seems silly to even describe these things, but I’ve seen this poor approach as standard across much of the software development world.

Effective software demonstration and project status delivery

We have refined a much better way to deliver software demonstrations and project status updates. The short answer is, “make a video”. The long answer is to make a comprehensive demonstration and project status update video, deliver it to all interested stakeholders, then have a meeting to discuss the demonstration and states. This results in an easier, deeper, and more thoughtful meeting and also serves stakeholders who can’t attend.

Every demo/status video serves a number of purposes and audiences; so it’s important to cover topics of interest to all kinds of stakeholders, not only the stakeholders most able to attend. At the same time, we don’t recommend creating multiple videos for multiple audiences; that is an unsustainable pace of content production, it takes too much time away from the core work of creating quality software.

Make one medium-length video per cycle (week/biweekly/whatever) to address:

  • Demonstration
  • Project progress summary
  • Upcoming work
  • Key open questions
  • Interesting or important technical details

In this way, each video is of value to both “local” stakeholders (the specific customer team managing the project from day to day) and broader stakeholders across a customer organization.

Next, the nitty-gritty of what goes in to a such a video and how to make it. The agenda should go roughly in this order.

Introduction / Title Slide

Files (including video files_ tend to be misclassified, mislabeled, and misplaced. Someone might open up your demo/status video and not know anything about what’s inside. Therefore, always start with a title slide. That slide should include:

  • Name of the project
  • Name and logo of the customer organization the project is for
  • Date (sometimes just month and year, for slower-paced projects)
  • Name and title of the person making this video (speaking)
  • Name, URL, and logo of the company working on the software (for us, “Oasis Digital”)

While the title slide is visible, briefly introduce yourself. You have only a few seconds of viewer attention; the slide and your introduction should last 10 seconds or at most 15, before you cut to the next section.

Still video is a waste of bandwidth, and drives viewers away. Never let the video stay still while you talk for more than a few seconds.

Demonstration

After that brief introduction, jump right into the demonstration. If you learn only one thing about effective demonstrations, here it is:

Get to the payoff fast.

Don’t wander through a long buildup in which only the most dedicated viewer can reach the important part. Show the payoff, the most important bit, within the first few minutes. Then, go back and explain the rest of the story to give a comprehensive demonstration of use cases.

Your demonstration should bring the viewer through one or more use cases relevant to the work underway. Through these use cases, remind the viewer of the overall purpose and functionality of the software project, and point out the new and changes parts, showing progress.

Demonstrations tend to go wrong, or to waste a lot of time, by default. To produce a quality demonstration:

Practice.

Yes, practice. Jot down a terse outline of what you plan to demonstrate, and practice it a couple of times (with the video recorder running) to get familiar with exactly what will happen. If you see anything urgent to fix while making these practice attempts, you might stop and fix it right then. Then once your practice demo goes well, record the real demo.

In a demonstration of a user interface, text and UI elements be readable. We get the best results by sizing the software and recording a “stage” of 1280×720 pixels. A video that size can easily be played back in a non-full-screen window on a typical computer. If your software under demonstration can’t be used at the small window size (i.e. screens that really only work at 1920 resolution), make sure to boost font sizes.

(Some stakeholders, including quite important ones, might only have an opportunity to watch your demonstration video on their cell phone! Think about font and other element sizes accordingly.)

Lastly, create a demonstration you can be proud of. If your demonstration went badly, discard that recording and do it over. If you have been keeping your demonstrations tight, it won’t cost much time if you occasionally have to discard and try again.  If your demonstration is so long that starting over is unthinkable, make shorter demonstrations more often.

Project status and management update

After demonstrating progress on the software, provide an update on the project. We heartily recommend the following order:

  1. Review at what has been done since the last update; positive progress
  2. Preview at what is coming up next; anticipated progress
  3. Discuss upcoming key questions or issues that could delay or prevent progress

Point 1 is especially important and easily overlooked. We have had projects which were objectively going extremely well: delivering a pile of valuable functionality every week for years on end. But looking back, it’s easy to get in a meeting rut – the tone of a project can be ruined by an inadvertent meeting focus on only what is going wrong. Therefore, before discussing what is coming up in what might go wrong, always briefly summarize what has gone well.

The details of how to show status and upcoming work vary by your methodology and toolset. We most often use Jira, and to talk about these things by scrolling, clicking, and talking about an Agile Board in Jira, often supplemented by a Dashboard. You can do the same with other software, or even with a manual project management system.

Obstacles and questions

Having shown visible progress in the demonstration then talked about project status, you now have the viewers’ attention to deal with challenges. Most likely any obstacles or questions are connected to issues in your project management tracking system; so click back through the relevant ones and discuss these things. Make sure to show the relevant part of the software and the relevant bits in the project management software. (Reminder – never more than a few seconds of still video with just a person talking.)

We have found that our recap of obstacles and questions on video, can be very helpful to our customers representatives. They can show the video to other people in their organization who might be able to help with the obstacle. They can listen as well as read – some people enjoyed listening more than reading. They can arrive for a live meeting, already having thought about the questions and ready to answer.

Technical

The last major section of a demo/status video should dig into any interesting or important technical aspects. Here is the chance to show an IDE or source control tool instead of just the running software or Jira board. Most likely the technical bits worth discussing will concern either recently completed features or features coming up shortly, but sometimes a broader topic might warrant attention.

In our experience, digging into the important technical details can also support rapport and credibility with more kinds of stakeholders. Every organization contains a mix of people most responsive to project management, and others most responsive to technical depth.

Closing

As your video ends, flip back to the title slide and thank the viewer for their attention. As hard as you may have worked (more than the length of the resulting video, sometimes much more), your viewer has also dedicated their limited time to watch. Thank them.

Video and audio production tips

Surprisingly, often the most important aspect of video production is audio. You need a quiet room and a decent quality microphone. The former can be hard to achieve in a busy crowded workspace, but it’s worth the effort. Hide in a conference room. Get a coworker to stand guard at the door.

An amply good microphone costs well under $100. We’ve had good results with various types of headsets (but read more about that later), with Blue Snowball microphones, and with a popular Audio Technica model. All of these are quite inexpensive. Any of them are vastly better than trying to use a laptop’s built in microphone.

Next, screen video. You’ll need appropriate screen video recording software, and you will need to master its configuration. We recommend:

  • ScreenFlow, on OSX
  • OBS, on Windows

Video is about more than just the screen though. If you’ve made it this far into this post, you are ready for perhaps the most important advice of all:

Show your face

A demo/status video is not only about information delivery, it is also about personal connection. Humans are hardwired to connect with other humans while looking at their face. Therefore your face should be visible in the video. Both of the software packages above can easily show your face in a corner of the screen. Do so.  (Back to the headset idea – a headset can provide excellent audio pick up, but then you will be wearing a headset in the video. Therefore the headset is not the best solution for this use.)

Video of your face means you need a camera. Most laptops have an amply good camera built-in (but sit your laptop on a stack of books or something handy – so that the laptop camera is not looking up your nose!). Or add an external webcam (< $100) atop an external monitor for better results.

Speaking of cameras, cameras detect light. Rearrange the lighting in your space (or add a $30 lamp) to get some light on the front of your face during your video recording. Your eyes should not be in shadow.

If your recording software supports it (both of the above mentioned packages do), add a “bug”, a term of art for a partially transparent logo in the corner of the screen. For example, if you decide to put your face in the upper right, then the lower left of the screen could contain your company logo at 50% transparency. A video is a branding opportunity in addition to an information communication opportunity.

Finally, reread the advice earlier in the demonstration section, about font and screen recording sizes. Then read them again. 🙂

Feedback wanted

We have worked out the advice here over years of various attempts to communicate demonstration and status information well. But we surely have much more to learn, and appreciate any feedback readers send. Thanks for getting this far, and good luck in your demonstrations and meetings.

Angular Runtime Performance Guide

Co-authored by Paul Spears and Andrew Wiens

1.0 Introduction

Smooth, highly-responsive interfaces increase users’ confidence in an application and create an overall positive experience. Whereas small applications with simple interactions are built without a focus on runtime performance, standard approaches sometimes do not scale well as the data size or feature complexity increases. A common scenario that may be familiar to the reader is a table that works well with small quantities of data but begins stuttering and lagging when the amount of data is increased. This guide will show how to increase performance in these kinds of applications.

Additionally, high framerates enable developers to build entirely new types of applications with Angular. Introducing animations and interactive graphics create new and exciting ways to engage with users. Here at Oasis Digital, we used the techniques in this guide to build an interactive visualization for issue tracking [1], multiple customer projects and a demo application that showcases the kind of performance that is possible within an Angular application [2].

Although we typically write Angular applications with relatively little concern for what Angular does behind the scenes, in performance-sensitive applications we achieve the desired responsiveness by knowing more about how Angular works. In this regard, an app’s implementation can have a large effect on performance: while Angular’s change detection system can complete hundreds of thousands of cycles in a few milliseconds for simple changes, application logic takes the overwhelming majority of time to execute. In this guide, we will describe how to meet the expectations of performance-sensitive applications, explain the relevant parts of Angular change detection, and highlight potential pitfalls along the way.

2.0 Toward 60 Frames Per Second

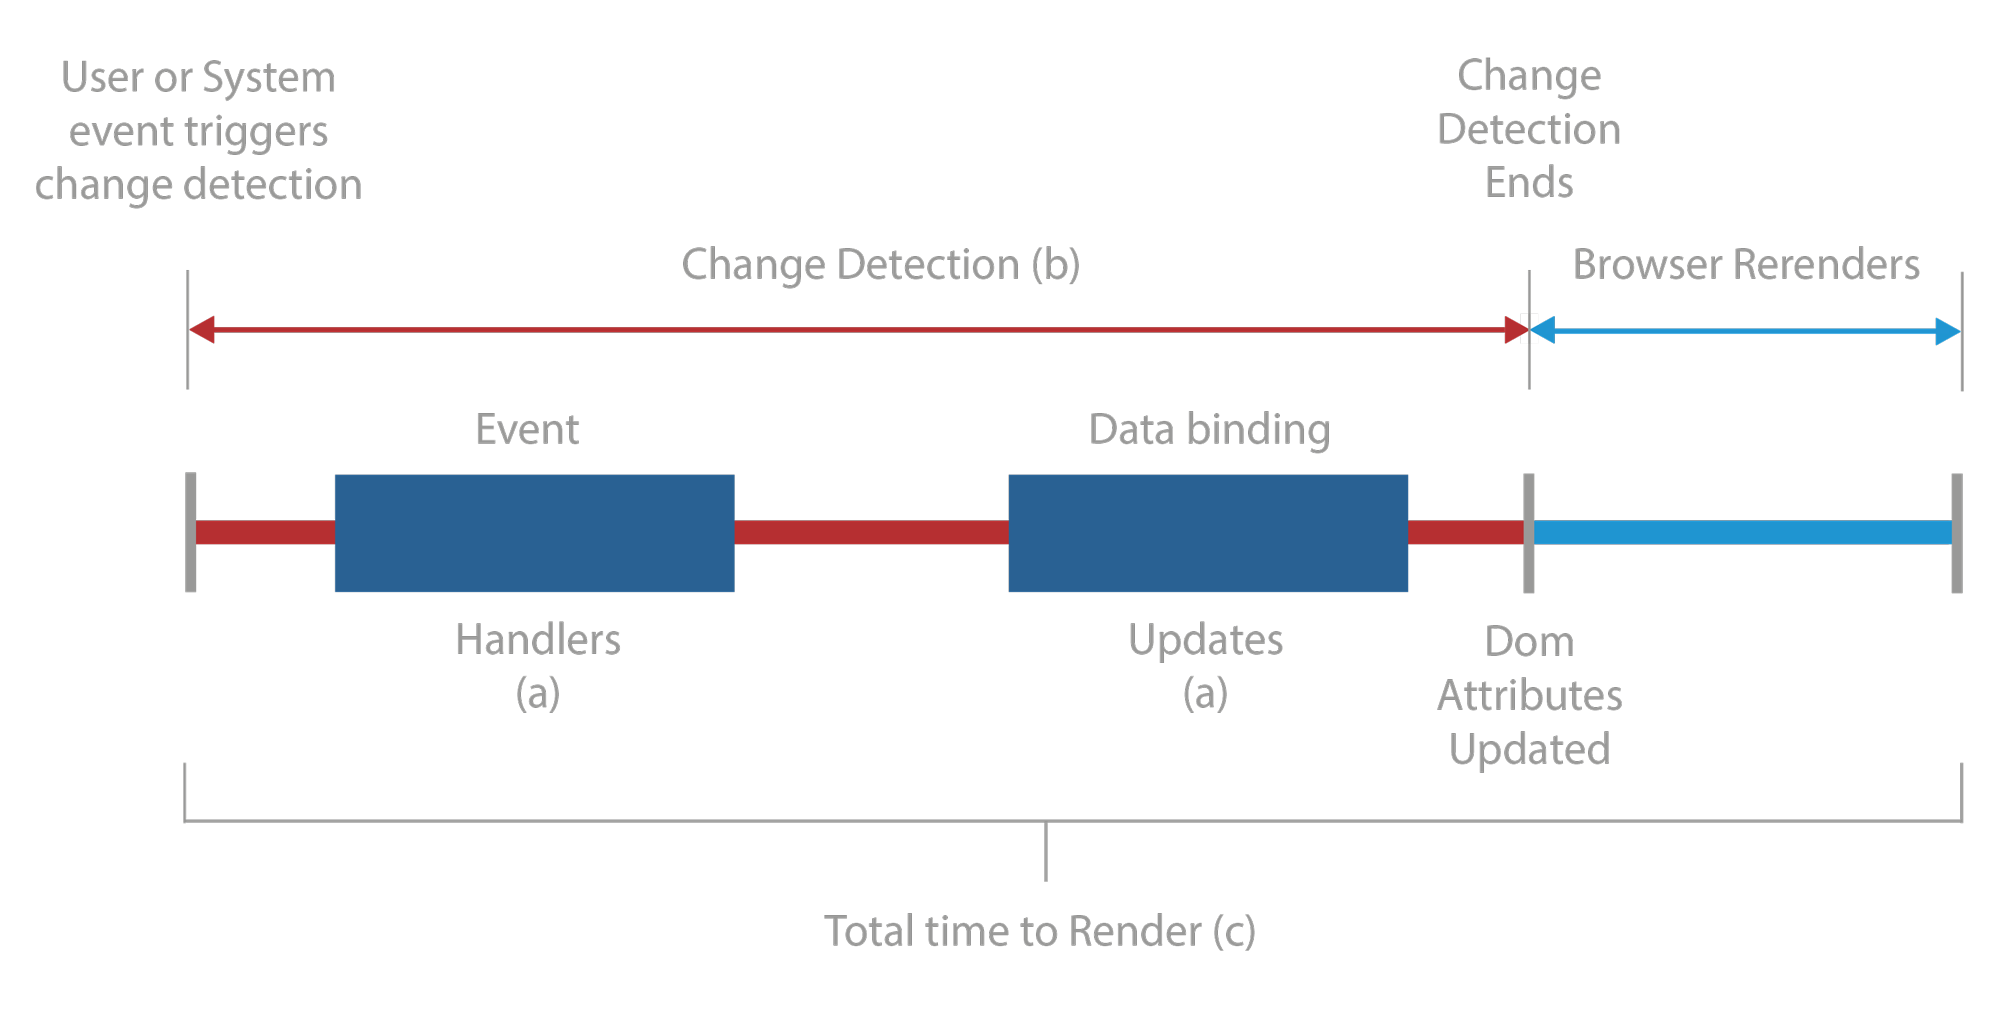
Fig. 1. Top level overview of execution control during change detection. Angular (red) calls application code (A; dark blue) during change detection (B) and updates the DOM. The browser (light blue) then updates the view, completing the change detection cycle (C). This cycle must complete in less than 17ms to achieve 60 FPS.

In the industry, 60 frames per second is the gold standard for application responsiveness, and any application that achieves it must render updates in less than a mere 17 milliseconds. Performance most often suffers in Angular applications when responding poorly to user input or other regularly-occurring events. The total time to re-render a view in response to any changes can be split into three parts: First, as shown in Figure 1A, application-specific callbacks are executed. Second, Angular’s change detection system runs as shown in Figure 1B. This system is responsible for delegating control to the application callbacks and using the results to notify the browser of any necessary DOM updates. The third piece in this process, the browser, paints the required changes. The application then waits for additional input before repeating this cycle (Figure 1C).

Since we generally only have control of our own code and how it interacts with Angular, improving runtime performance tends to involve optimizing three main aspects of our app:

  1. Executing application event handlers quickly
  2. Reducing the number of callback executions needed to complete a change detection cycle
  3. Reducing the execution duration of Angular’s change detection cycle

As the last two of these three aspects may imply, Angular’s change detection system has a substantial effect on runtime performance. Thus, it is important to gain a basic understanding of how the change detection system operates.

3.0 Angular Change Detection System

Once an Angular application is loaded, Angular listens for user events and other asynchronous events. Angular understands the context for these events and calls the appropriate handlers. After these handlers return, control is given back to Angular to perform change detection. Although Angular knows the data bindings between components, changes in other values may affect the template as well. For example, a template element may depend on a property of a shared object. Therefore, by default, the change detection system responds to updates by re-evaluating the template expressions of all components. If the change detection system determines that the value of a template expression has changed, it interacts with the browser to modify the corresponding portion of the DOM.

Fig. 2. Stepwise explanation of an Angular change detection cycle.

For example, a tree of components is shown in Figure 2. In this diagram, child components reside within their parents, and events can occur within any of the components. When a DOM event occurs, Angular will call the associated application event handler. Depending on how the application is structured, this may result in a component event firing rather than a DOM event. If a component event does fire, the associated event handler in the parent component is called, and this process is repeated. Once all events have been handled, Angular begins checking components and their templates for updates. This process starts from the root and works its way down to the leaves in a breadth-first manner.

Although this view of the change detection system is sufficient for our purposes, there are additional resources that explain the inner workings of this system. For a deeper explanation of Angular’s change detection system, see the blog posts from Victor Savkin and Nrwl.io [3-4].

4.0 Executing event handlers quickly

Event handlers can exist in numerous locations within an Angular application. The most obvious examples are DOM and component event bindings. An application responds to events such as mouse clicks or key presses by providing Angular a callback to execute as shown in Figure 3.

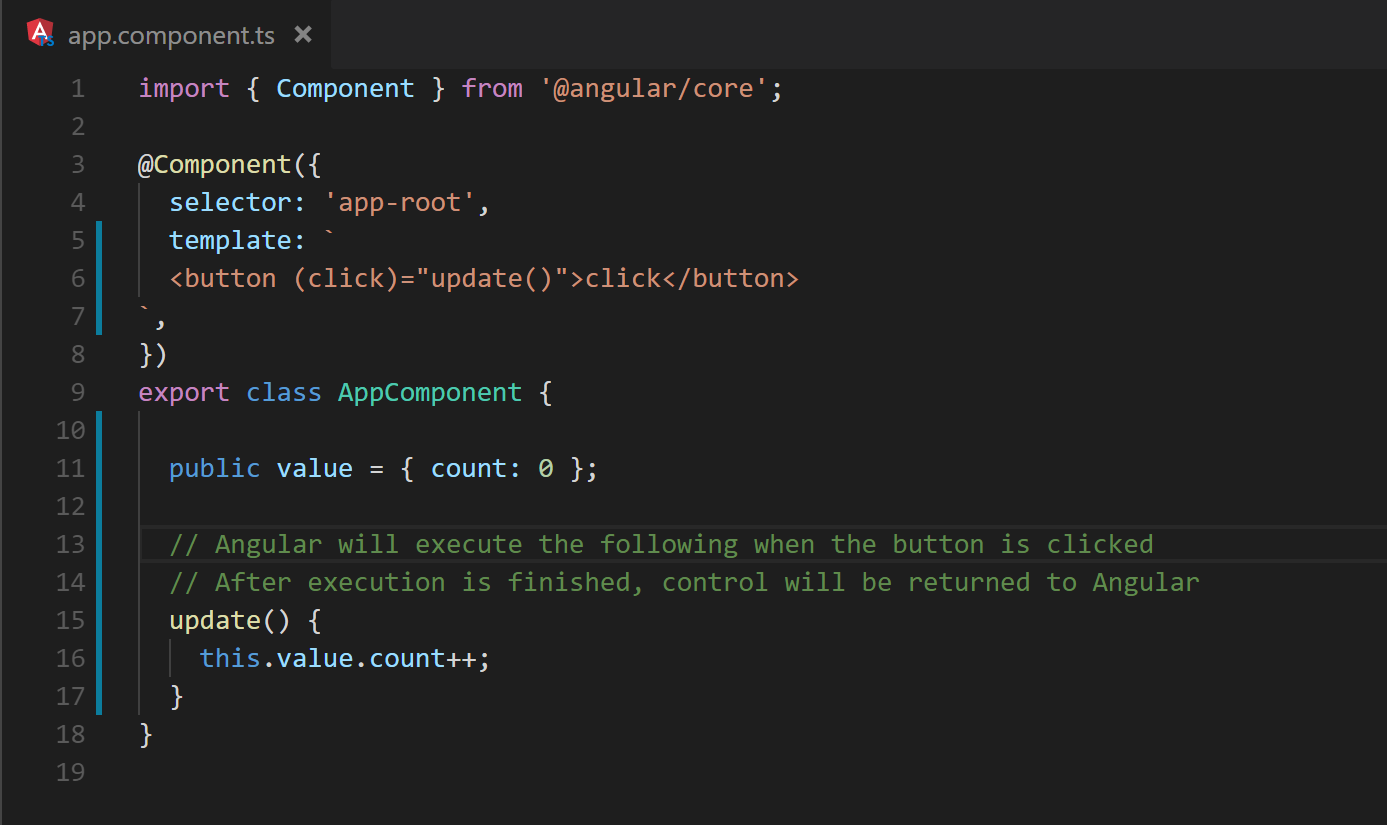
Fig. 3. A button executes a callback when clicked, effectively blocking change detection until the callback completes.

When such a callback is executed, Angular must wait for the callback to finish before change detection can continue. Once all events are processed, the change detection process evaluates template data bindings to determine which DOM properties to update. This process includes checking and updating component inputs. Angular provides developers control over how a component should respond to changes to its input bindings in the form of callbacks – OnChanges and input setters – which affect the execution time in a similar manner as event handlers.

The callbacks of event bindings, OnChanges, and input setters are the primary mechanisms for passing data between services and components in an Angular application, and it can be difficult to keep these slim. However, it is not always obvious how much code is executed during these callbacks.

4.1 Event Bindings

It is common practice to use event bindings for communicating user updates to shared locations such as services or components at a higher level of the hierarchy. Figure 4 shows a trivial example.

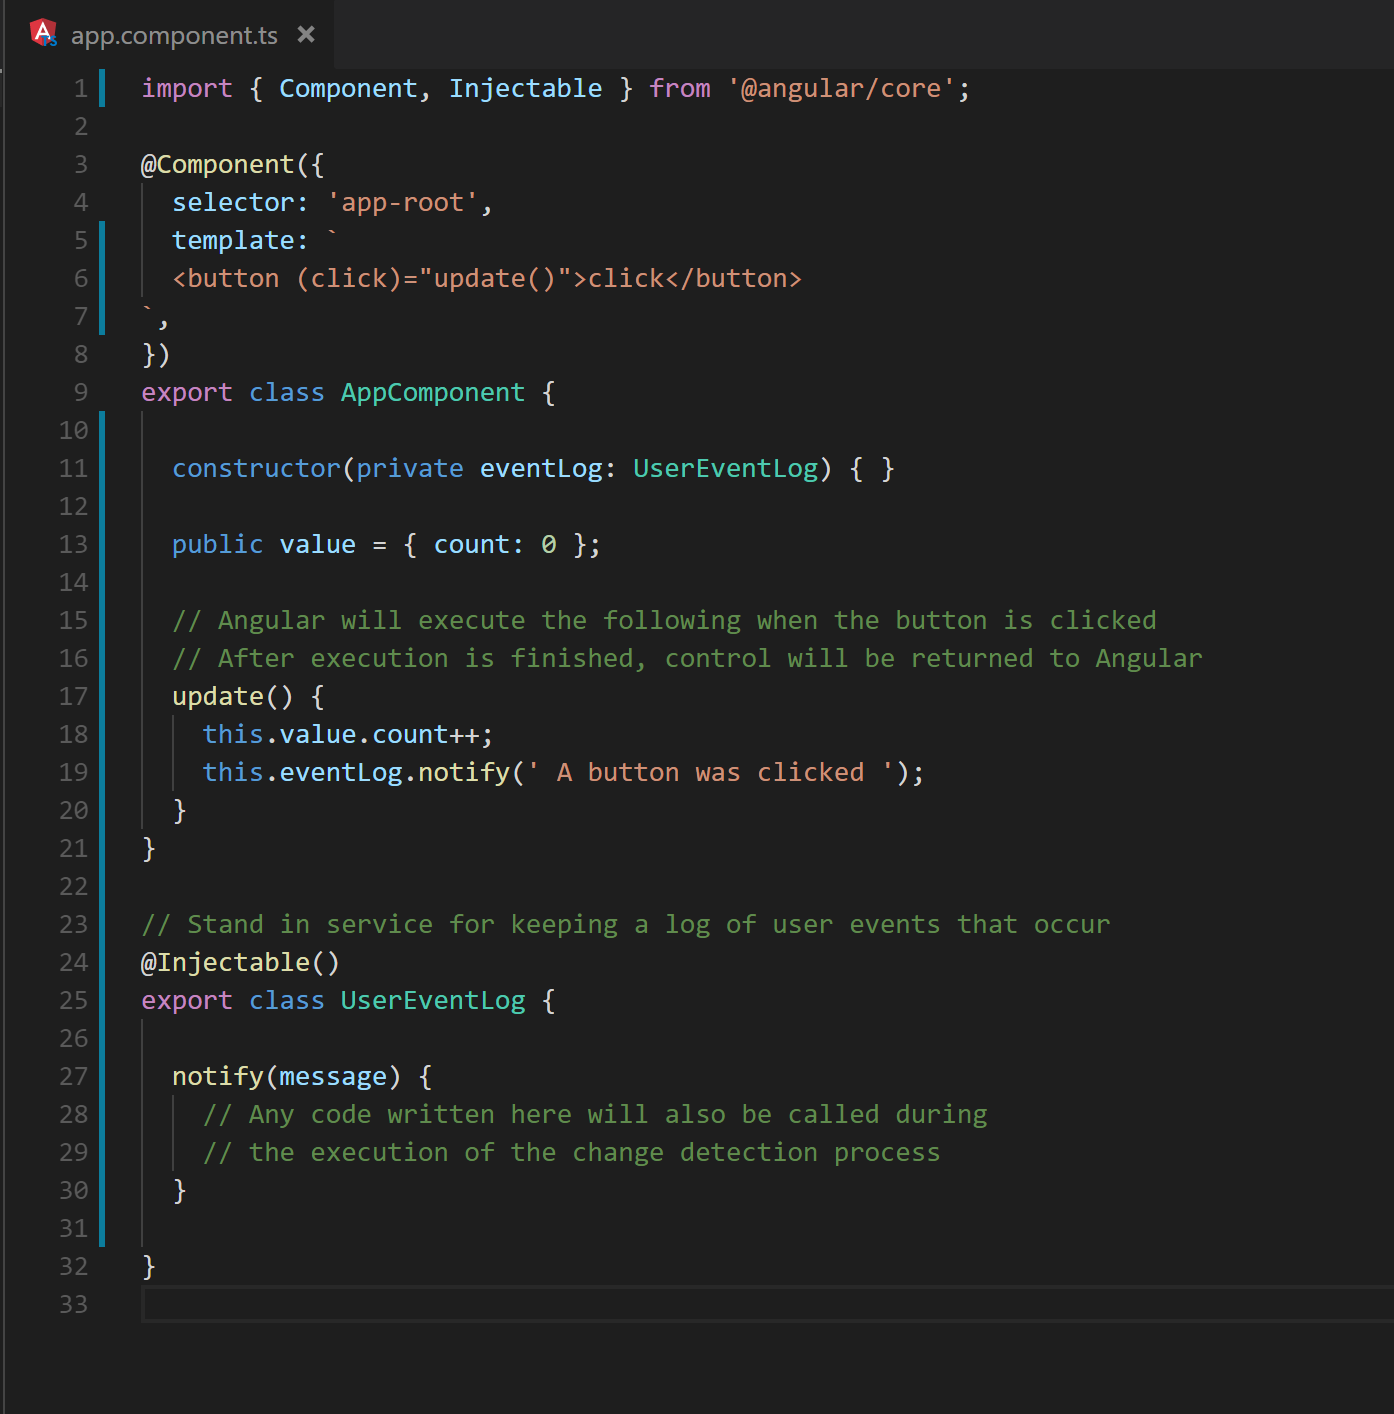
Fig. 4 A DOM event handler results in the execution of a service method.

As control moves between location,s additional processing is often required. For example, a search term combines with an array to produce a filtered list. The following code in Figures 5 and 6 demonstrates how a button click hands control to a long running service from the component. The service, in turn produces the filtered list.

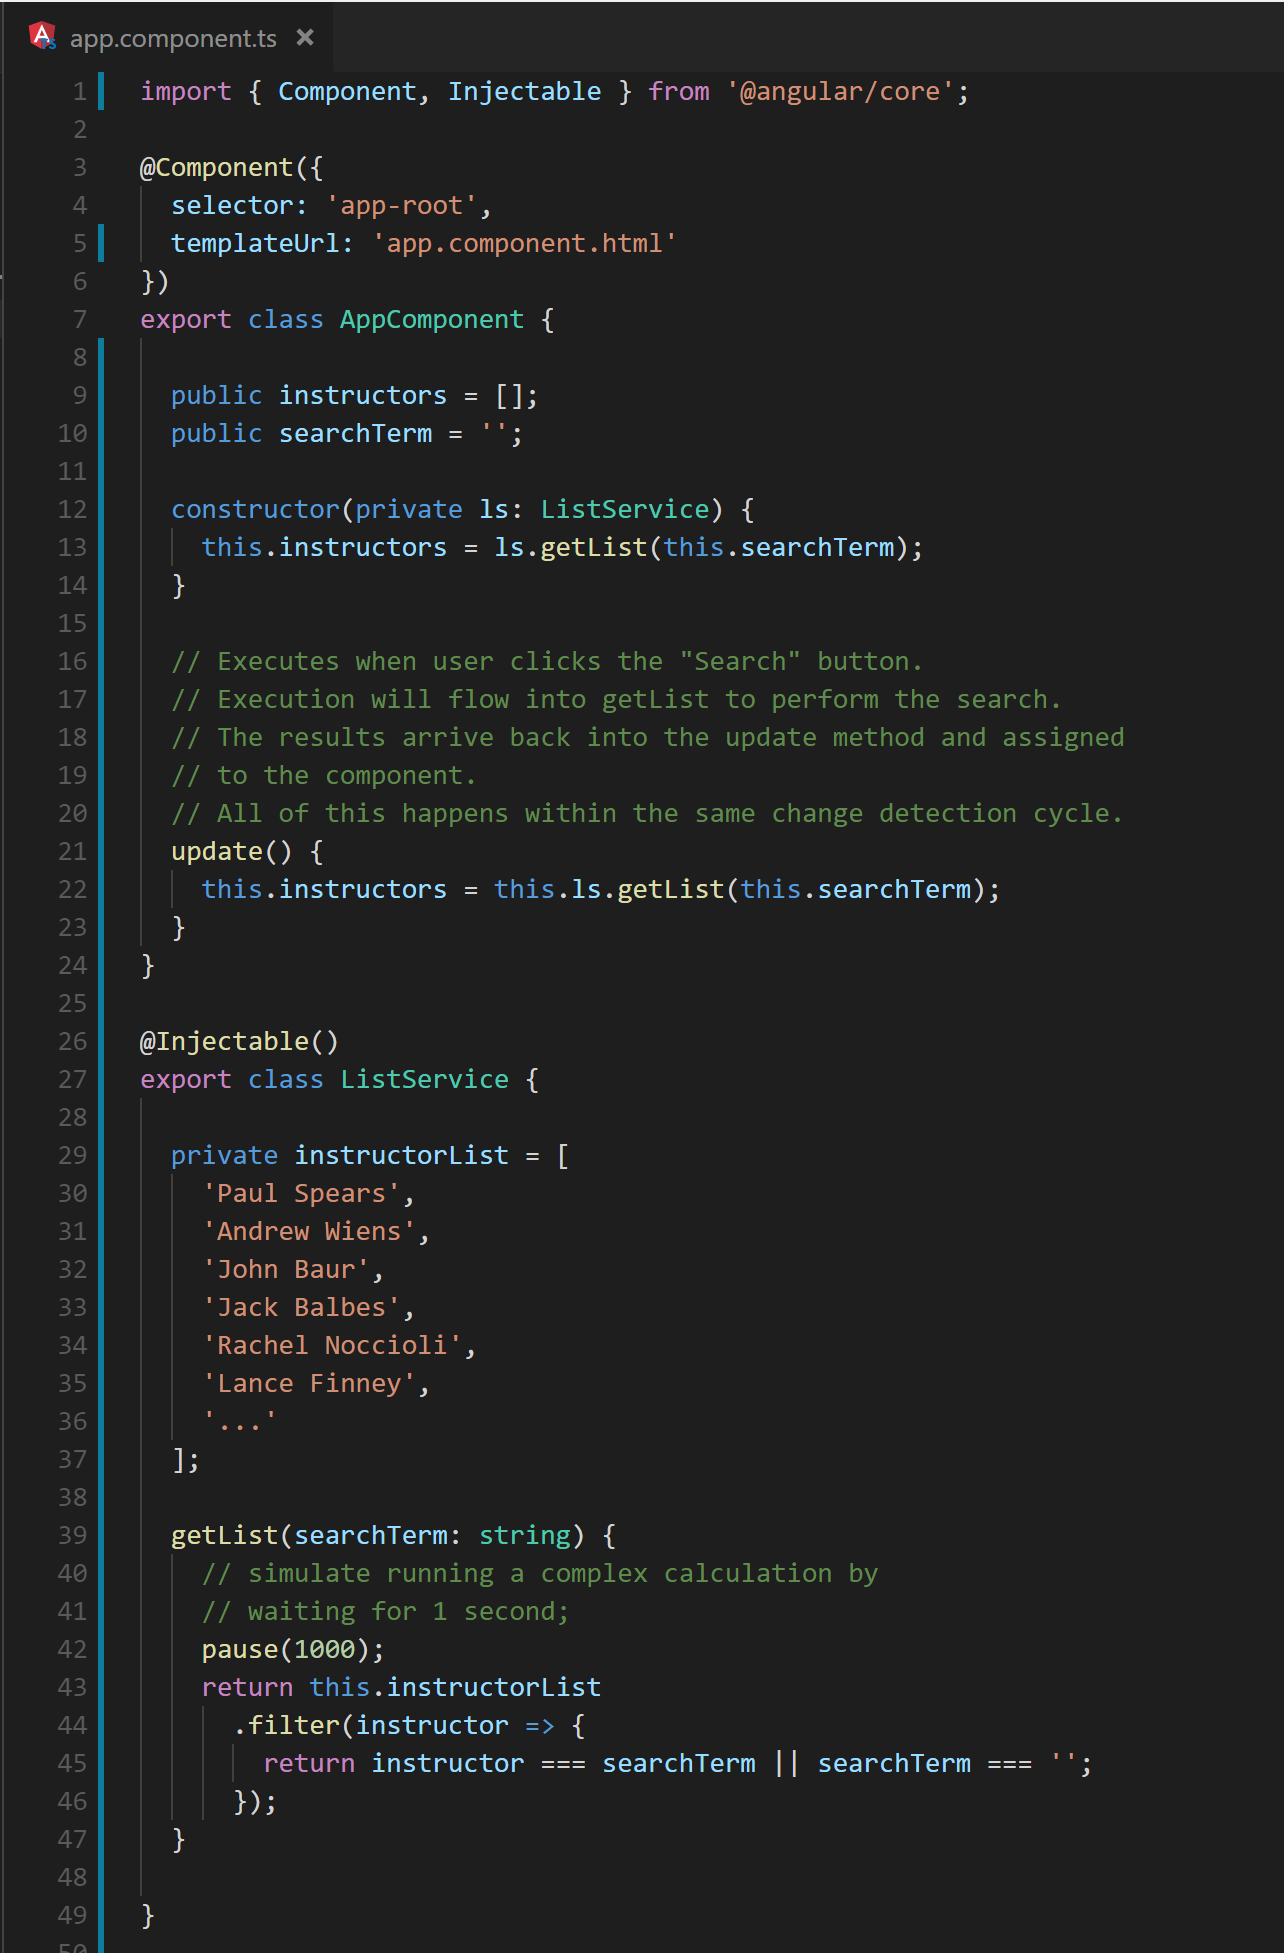
Fig. 5 A component and service cooperate to produce a filtered list of instructors.

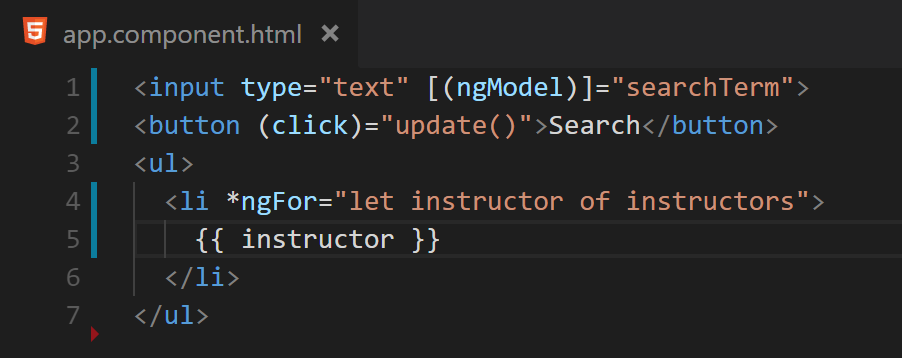
Fig. 6 The results of the calculation of Figure 5 are displayed on the screen with an ngFor.

Thus, a single event can percolate through multiple layers. By default, this computation will occur as part of the change detection cycle started by the original event binding. Figure 7 shows a stack trace of the click handler, change detection and the multiple layers of application code. Notice the “Long process” near the bottom of the image. This was inserted on line 42 of Figure 5 to emulate a calculation that could take longer than normal to run. The trace visually demonstrates that the change detection process cannot complete until all callbacks and their subsequent method calls have finished executing

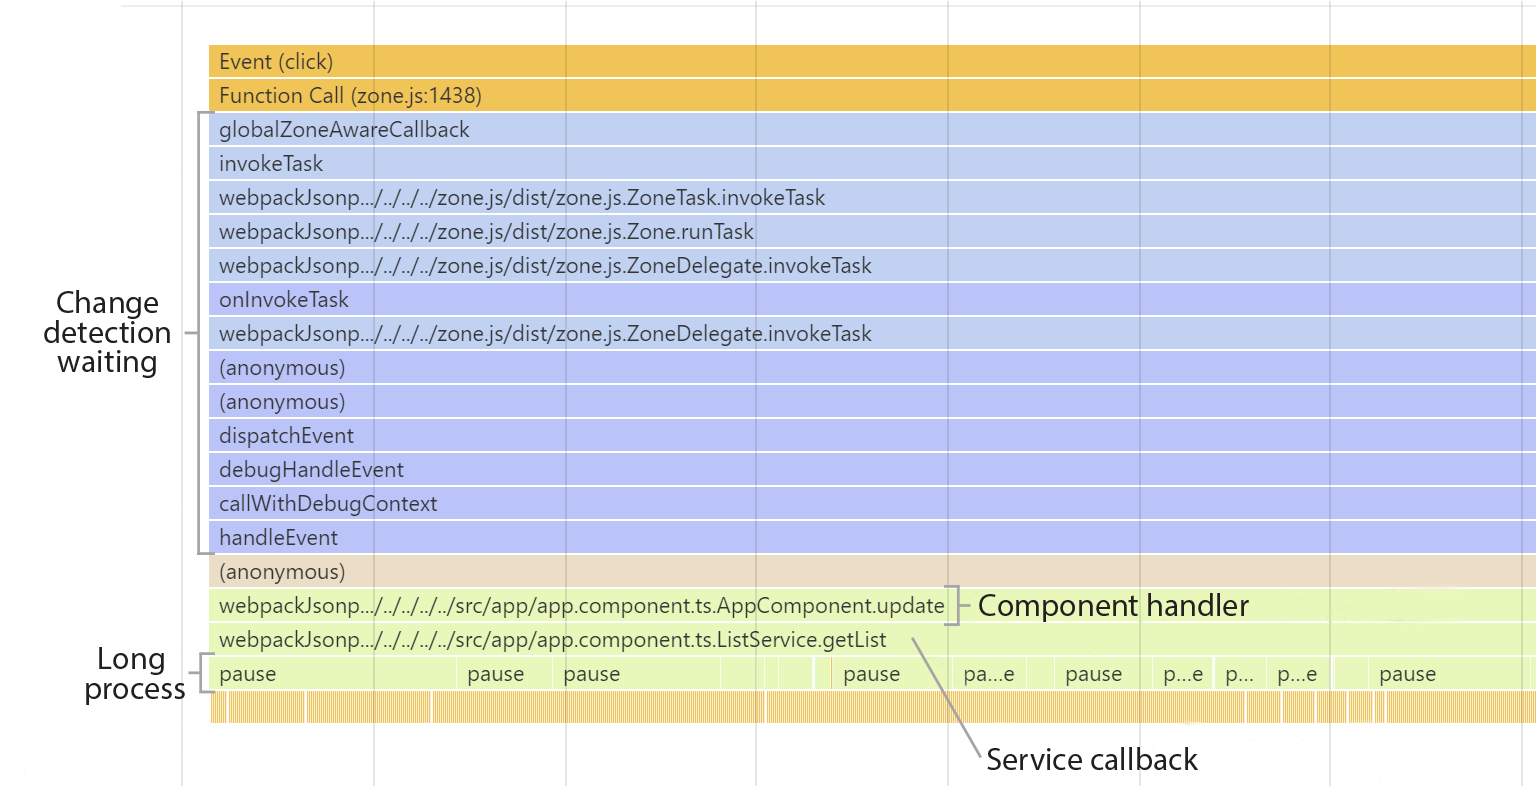
Fig. 7 A stack trace demonstrating control flow during a click event.

Though not always obvious it is important to remember that function calls usually executes as part of change detection regardless of where they reside. A key to performance is being cognizant of this fact and writing code that respects it.

The pattern of calculating a new application state from user and system events is often used with great success in many enterprise scale applications. In particular the use of a library such as ngrx/store or redux strongly encourages it. In these situations, it is important to ensure that any reducers execute as efficiently as possible. Also, as we will see in the later section on RxJS Observables, it is also possible that event handlers may update an Observable. If the Observable pipeline executes synchronously, as in Figure 8, the cost of this computation is added to the total cost of the change detection cycle.

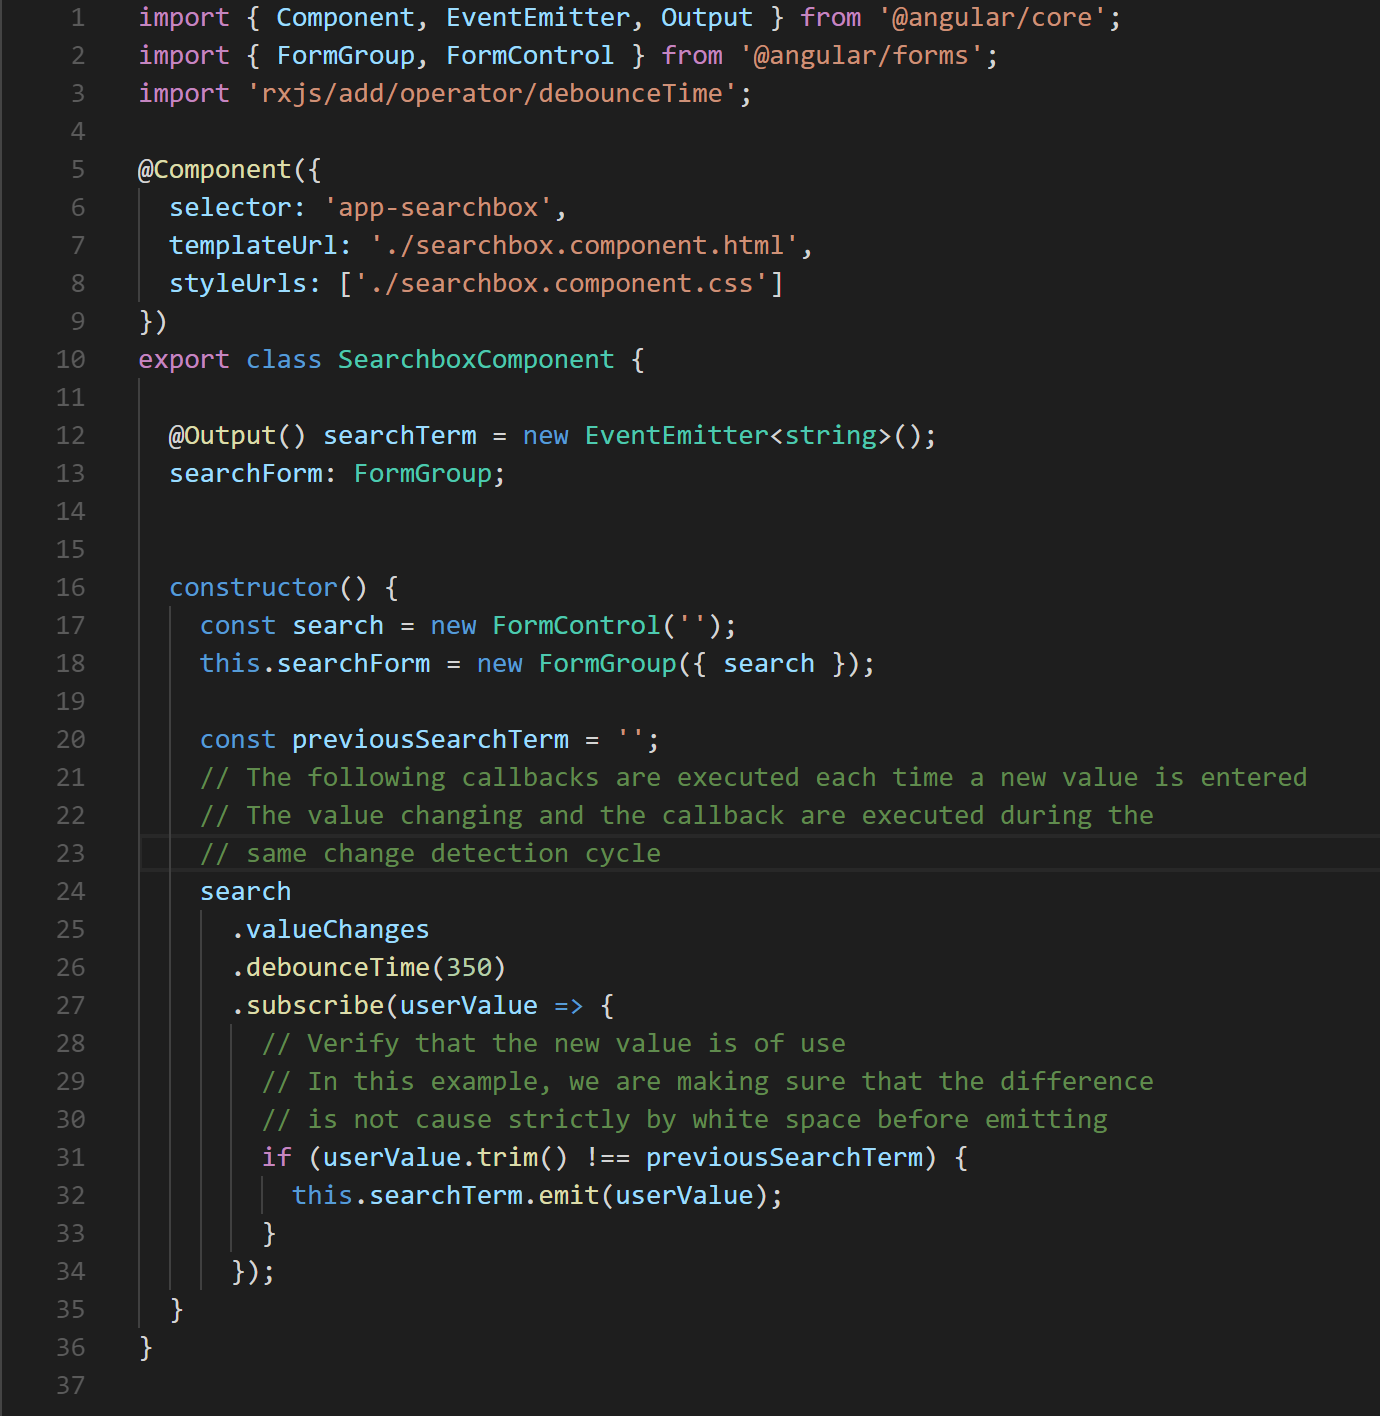
Fig. 8 The anonymous function defined on line 27 is executed as part of any change detection cycle in which the search value is updated.

4.2 Component Input Setters and OnChanges

Event handlers are not the only application code that executes during a change detection cycle. After event propagation completes, Angular continues the change detection cycle by updating the component hierarchy and template data bindings. As mentioned above, this process starts at the root component and works down towards the templates of the leaf components. Along the way, Angular will execute any setter methods associated with component inputs. Similarly, the ngOnChanges methods, similar to those in Figure 9 will be executed in components that implement OnChanges.

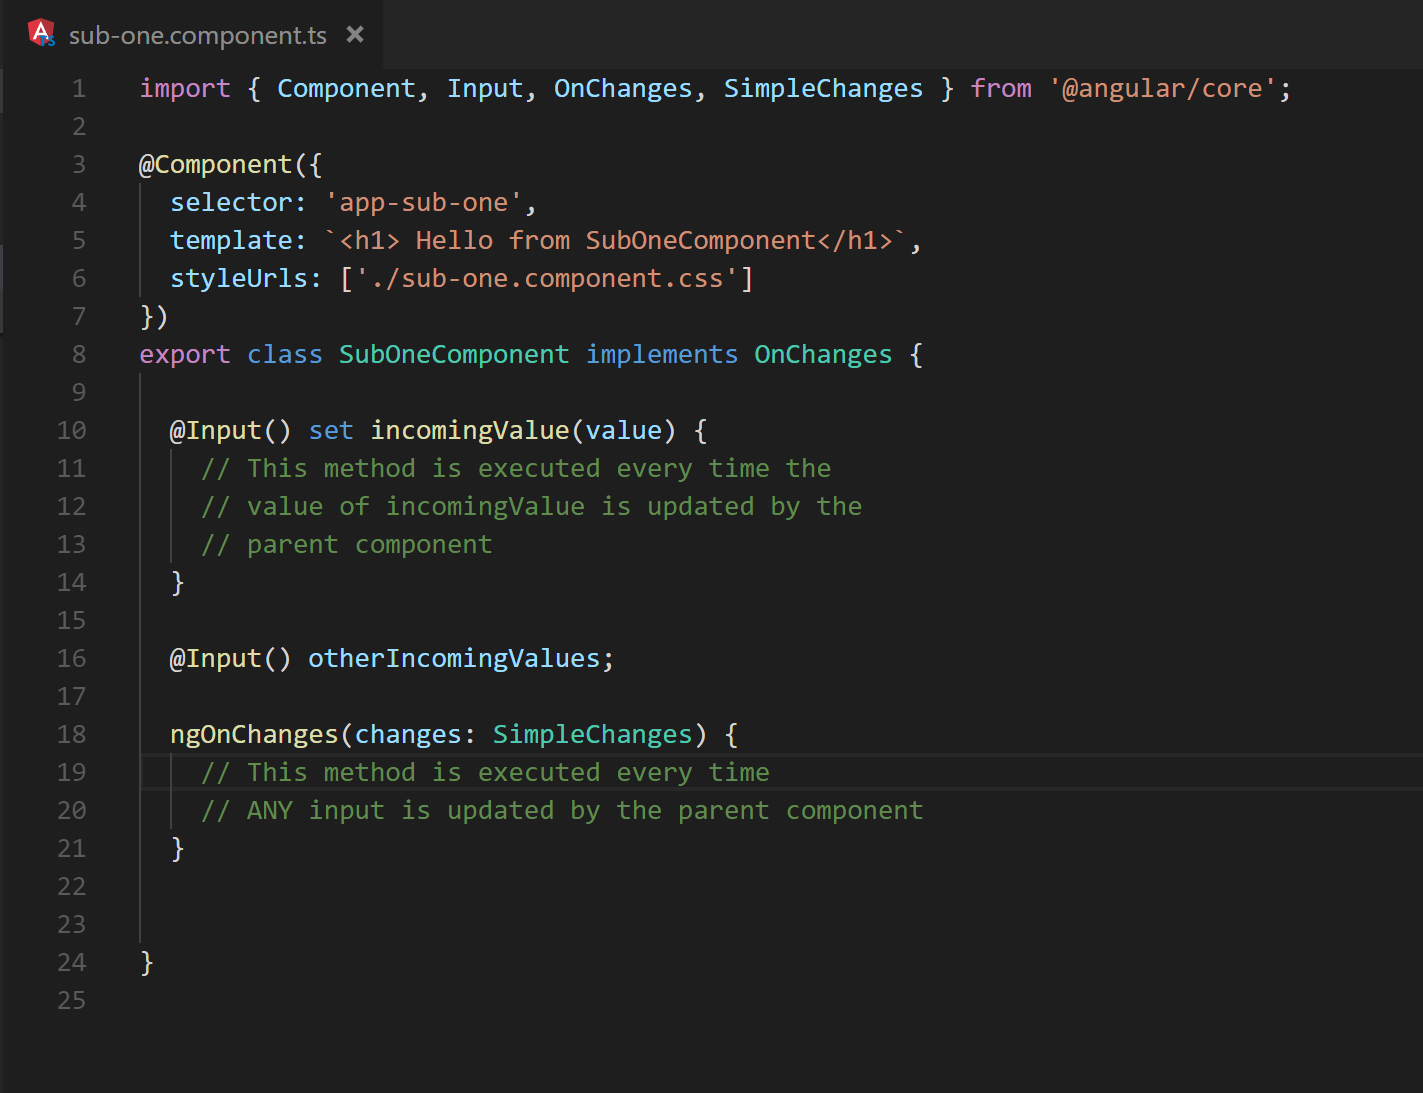
Fig. 9 Line 18 demonstrates the syntax for a basic ngOnChanges method.

Generally, problematic situations are created in the callbacks of the input setters and ngOnChanges relatively infrequently. It is often easier to spot problems when they do occur as issues are usually isolated to a single component. However, there are still a couple hazardous scenarios to point out. It is usually recommended to compute any state or UI changes needed as part of the event propagation phase of the change detection cycle. However, some situations may still occur that encourage the use of OnChanges to compute additional state needed locally within a component. Consider the filtered list example: For the sake of argument, assume that the current filter criteria and the unfiltered list are only available as inputs, and the filtered results must be computed immediately prior to display as shown in Figure 10.

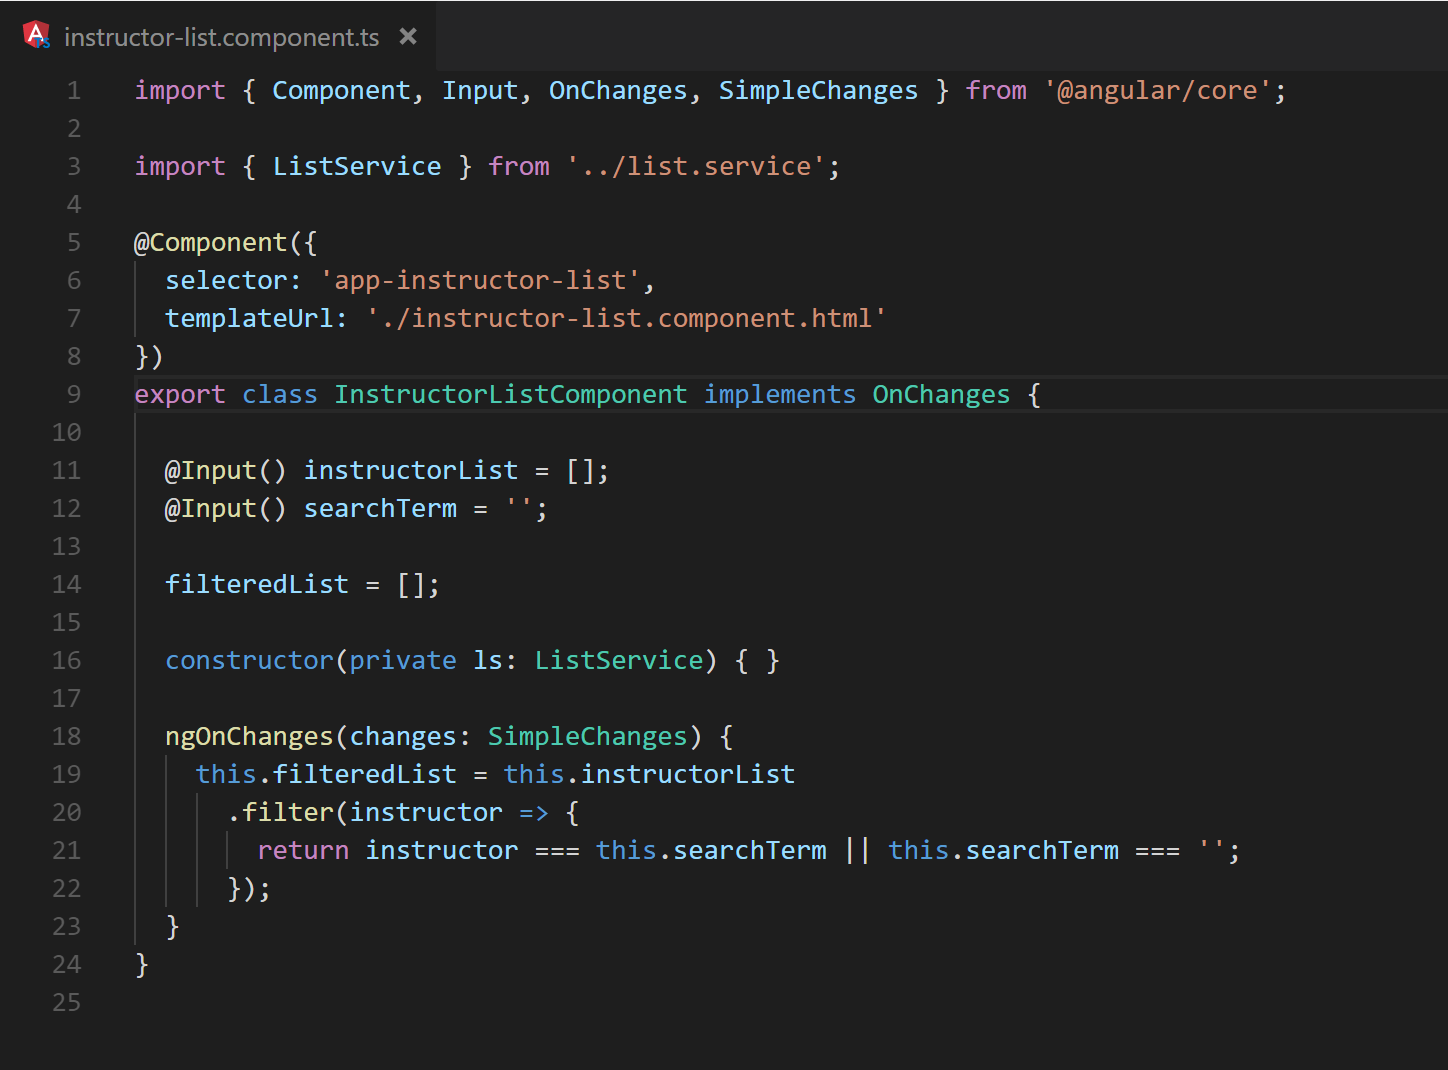
Fig. 10 Demonstration of recalculating a filtered list as Input values update

This could be achieved by utilizing OnChanges. However, doing so would cause every input change to trigger a recalculation of the filtered list. If another input were added to the component (see Figure 11), there would be a wasted calculation every time the new input value is changed.

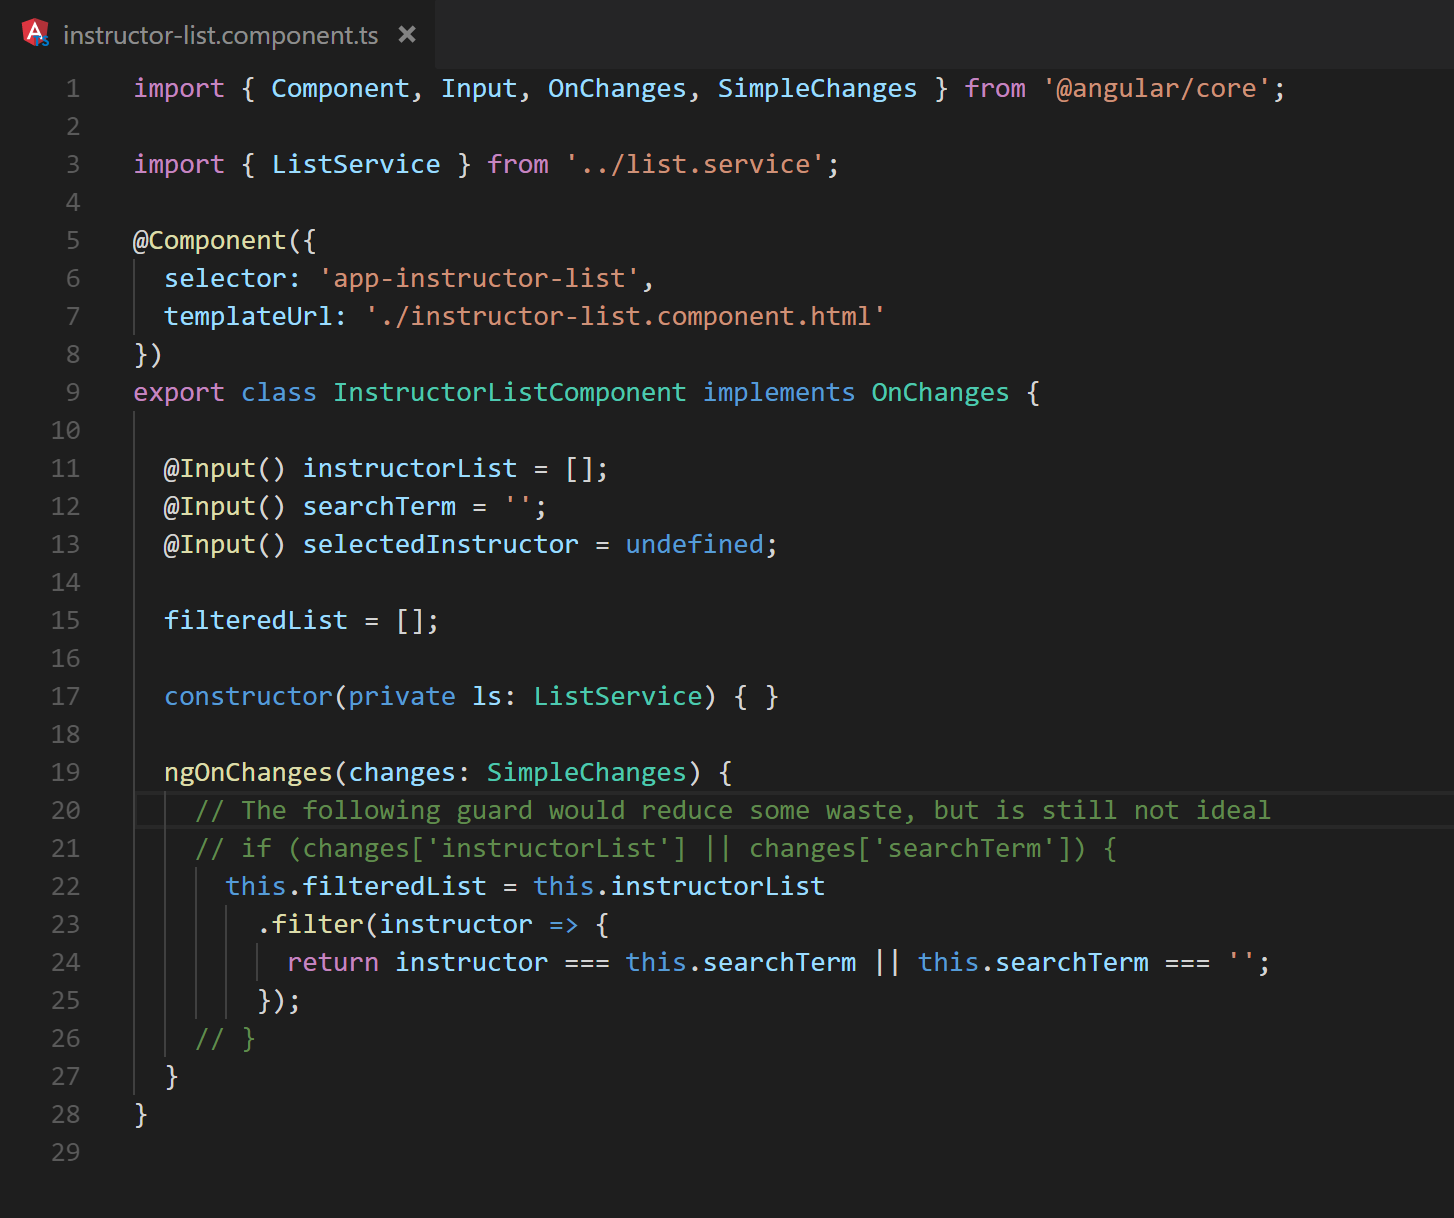
Fig. 11 The ngOnChanges method defined on lines 19 – 27 demonstrate a extraneous calculations that occur when the selectedInstructor is updated

Input setters serve a similar purpose as OnChanges, however they only fire in response to updates to a corresponding input. Generally speaking, the use of input setters will lead to more performant change handlers as there is no need for identifying which input changed, nor will it be called more often than is necessary. Although the granularity of input setters make for a better default choice, it is still possible to populate the callbacks with expensive operations, and they should be treated with the same level of care as OnChanges.

5.0 Reducing the quantity of call back executions needed

Executing application event handlers during change detection has the potential to hand execution control to multiple services and components. Being mindful of how the change detection cycle hands control to the various callbacks can help reduce its overall run time. For example, the updated values of any reactive form controls are passed to their subscribers, and the associated callbacks are then executed. This can be particularly costly if the application is undergoing a rapid succession of user input. If a debounce (.debounceTime) operator is applied to the value changes, then any processing is deferred until the input has settled. Figure 12 demonstrates the use of debounce by reducing the number of subscription callbacks that are executed. In this example the only values that are operated on are changes that occur after 350 milliseconds of stability to the search term.

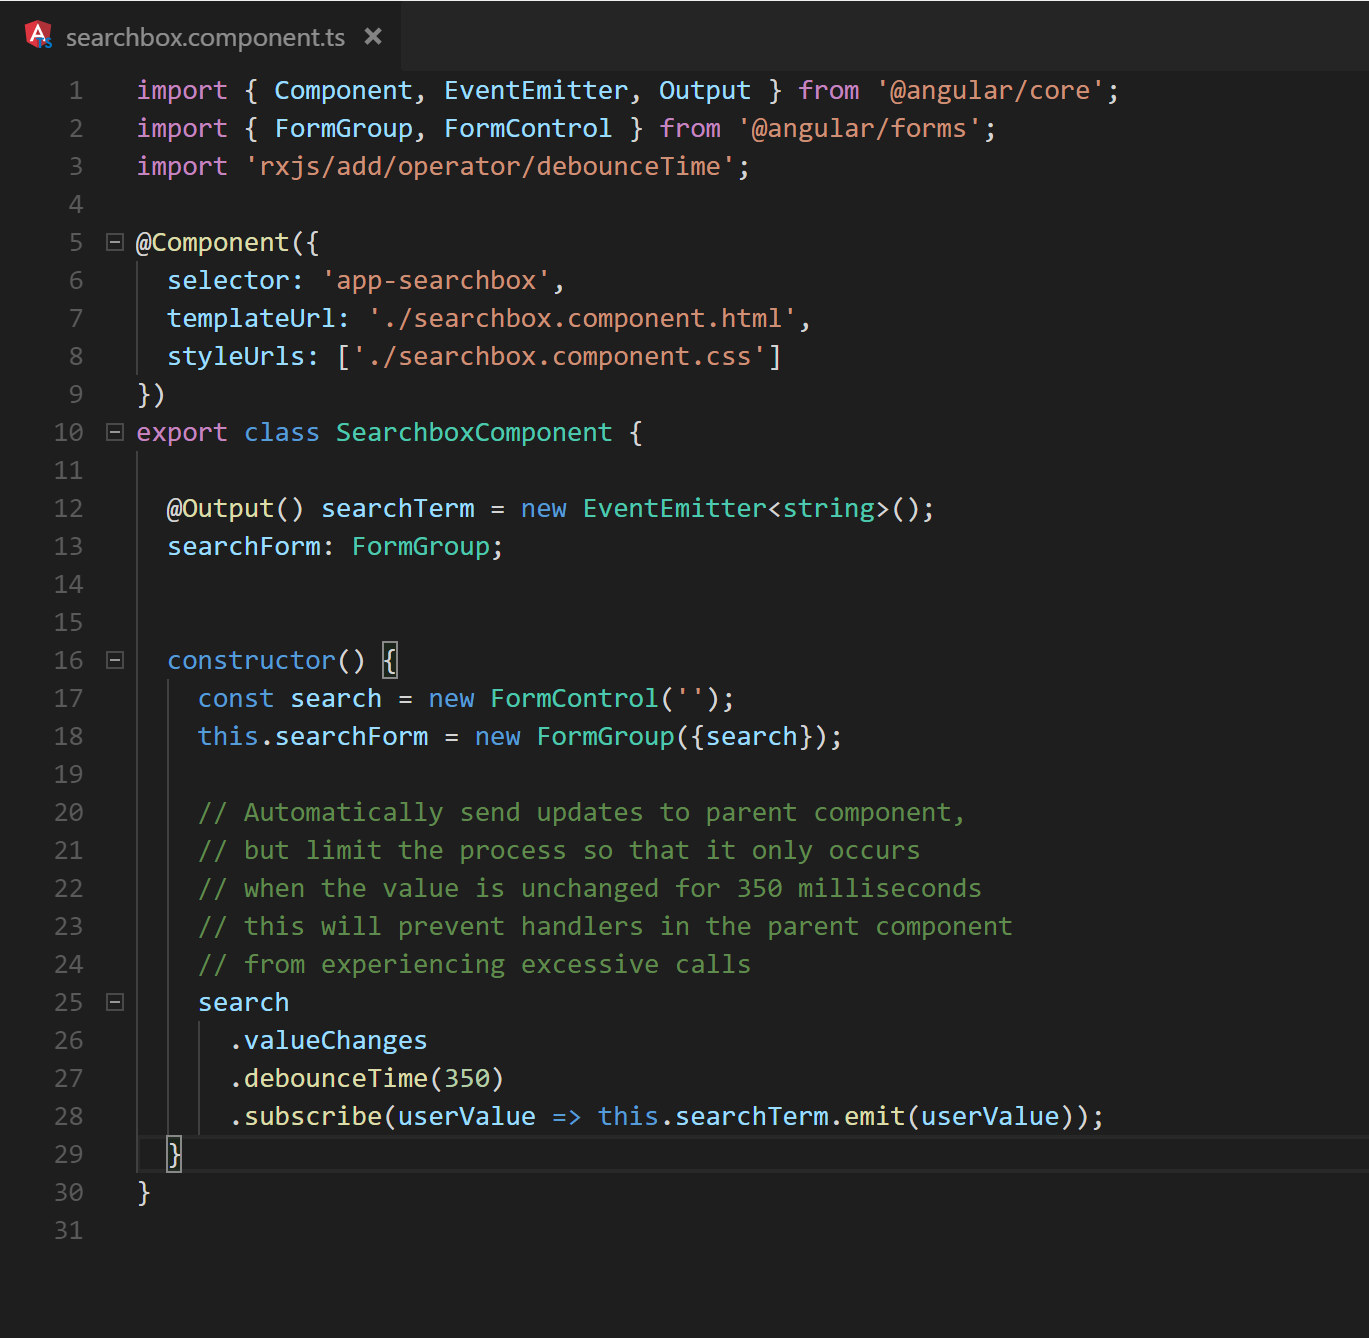
Fig. 12 A list filtering example that debounces the user’s input

Similarly, when choosing to emit values to event emitters, any duplicate events whose processing does not provide value should not be emitted. Figure 13 demonstrates this by emitting search terms instead of acting on them immediately. However, it only emits values that have a semantic difference to the previous value.

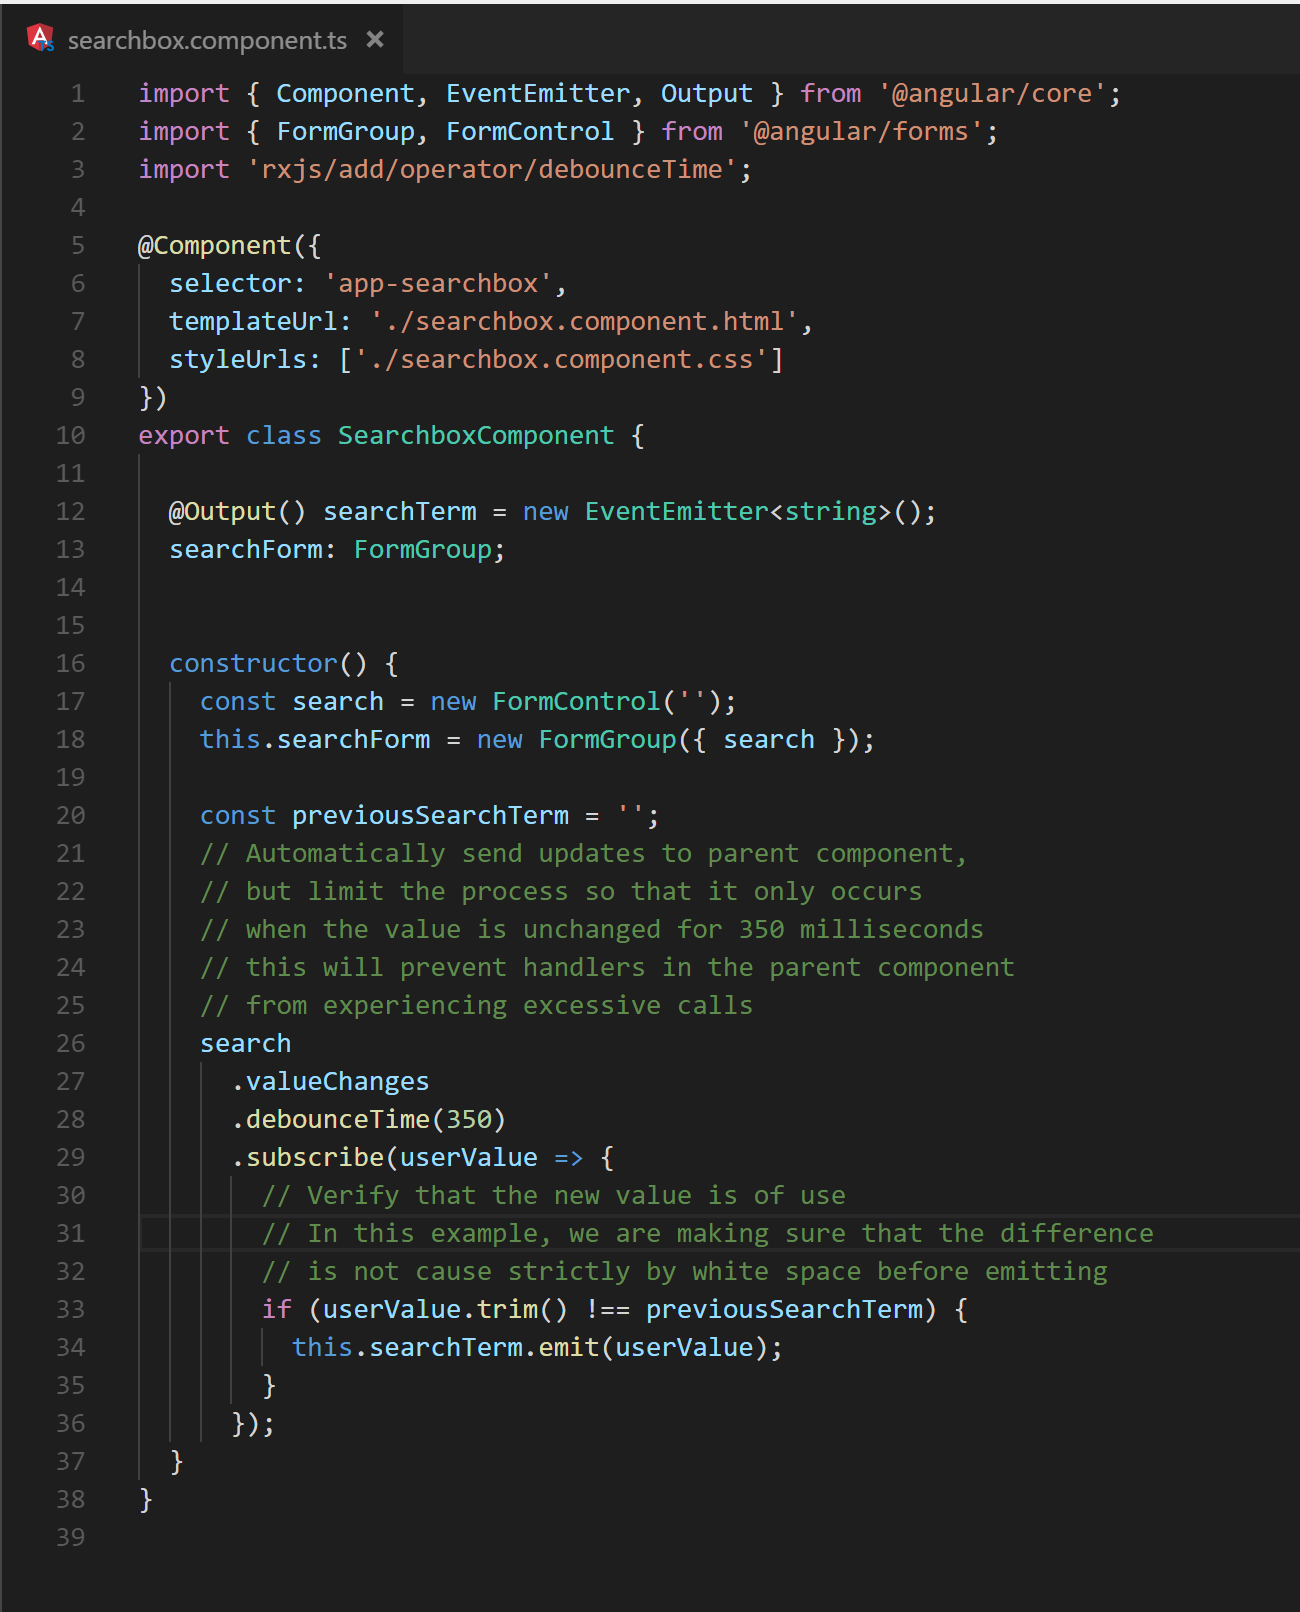
Fig. 13 A demonstration of selectively emitting values based on context

Also, when working with data-bound objects, Angular calculates equality by reference. This means that OnChanges will fire each time a bound object’s reference changes even if its content has not. Being intentional about changing such backing data can reduce the number of unneeded OnChange and input setter executions.

5.1 Controlling change detection

The effects of carefully controlling which callbacks are executed are magnified when taking direct control of change detection. The description provided earlier concerning change detection was based on Angular’s default behavior. However, Angular has an API that provides additional methods for controlling how and when change detection runs. The first of these APIs, ChangeDetectionStrategy.OnPush, will change the behavior of change detection for a given component. When applied, the change detection process will skip the component unless one of its inputs change or an Observable connected to an async pipe in its template receives an update. Consequently, any child components, located within the component’s template, will also be skipped. The change detection process can thus be reduced to only checking exactly what is needed to render changes by structuring the application to take advantage of this API. Figure 14 illustrates what this looks like by showing the step-wise checks that take place in one such scenario.

Fig. 14 Demonstration of change detection with OnPush in play

Utilizing this new strategy the filtered list code above can easily be rearranged to meet such a requirement as demonstrated in Figures 15 – 17.

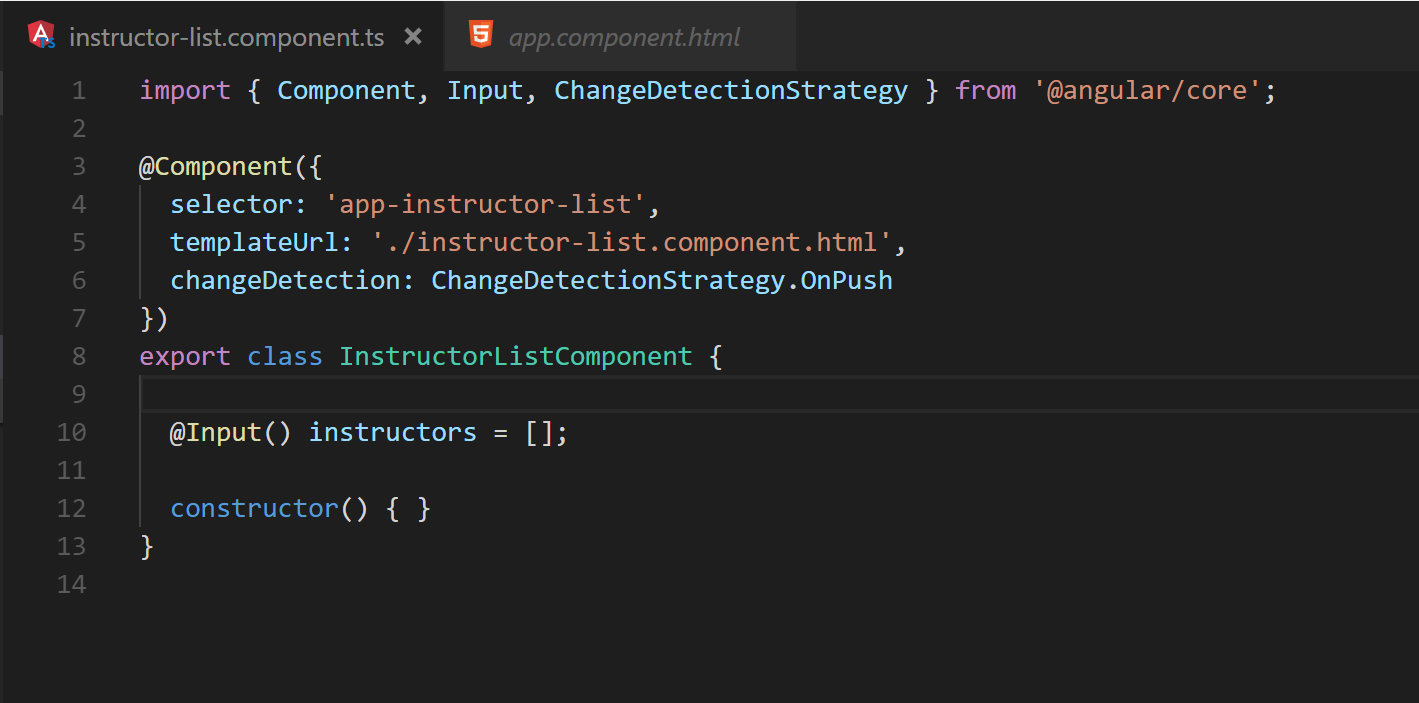
Fig. 15 The instructor-list component written to utilize OnPush. Notice that Inputs are the only source of change

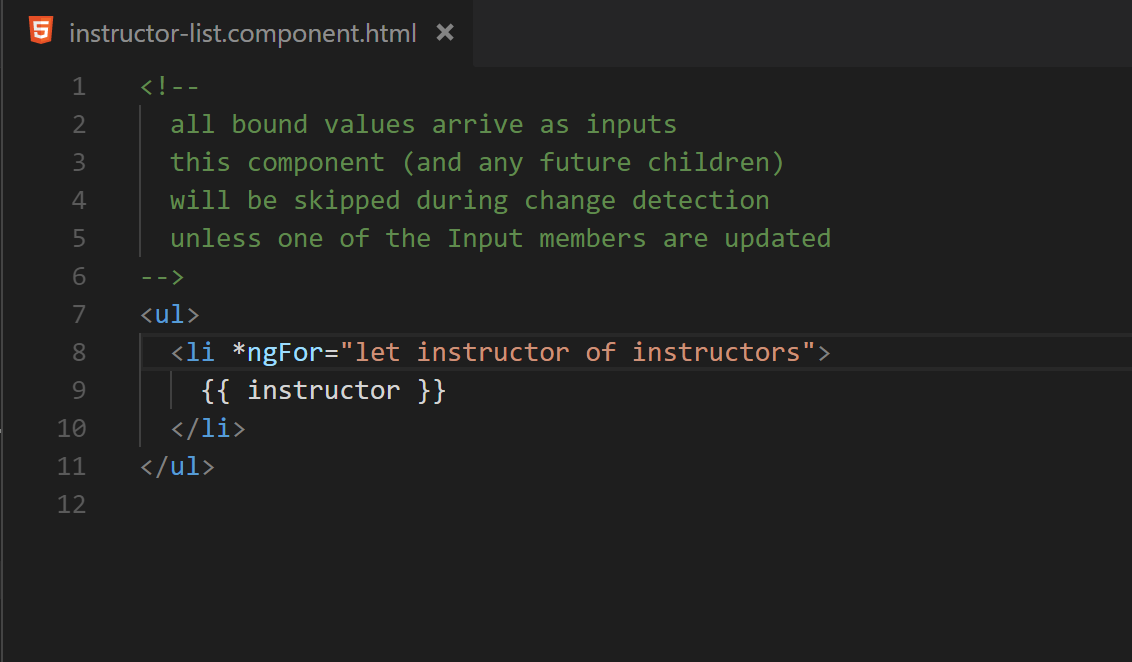
Fig. 16 The template for the instructor-list component is also free of data mutation.

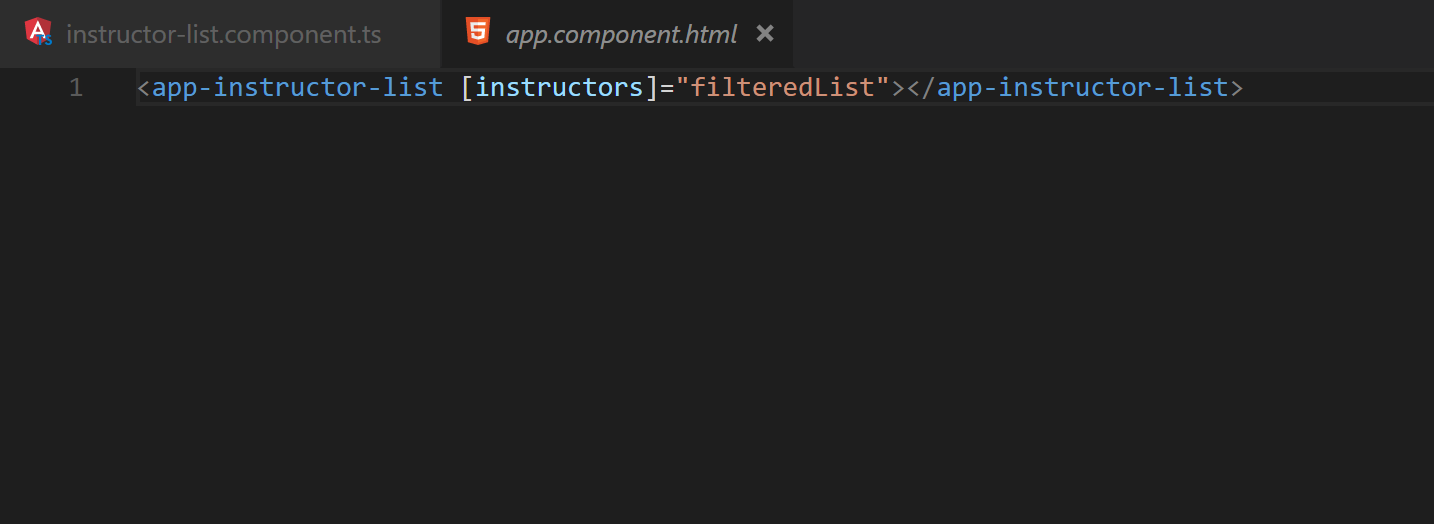
Fig. 17 The app-component html indicates that the filtered list is computed before providing it to app-instructor-list.

Alternatively, it is also possible to request that change detection be stopped entirely for a component. Figure 18 demonstrates some of the options available when controlling change detection manually. How to use this properly and effectively is highly dependent on the situation. It is rare that performance issues need this level of control to be resolved and its use should be reserved for exceptional cases.

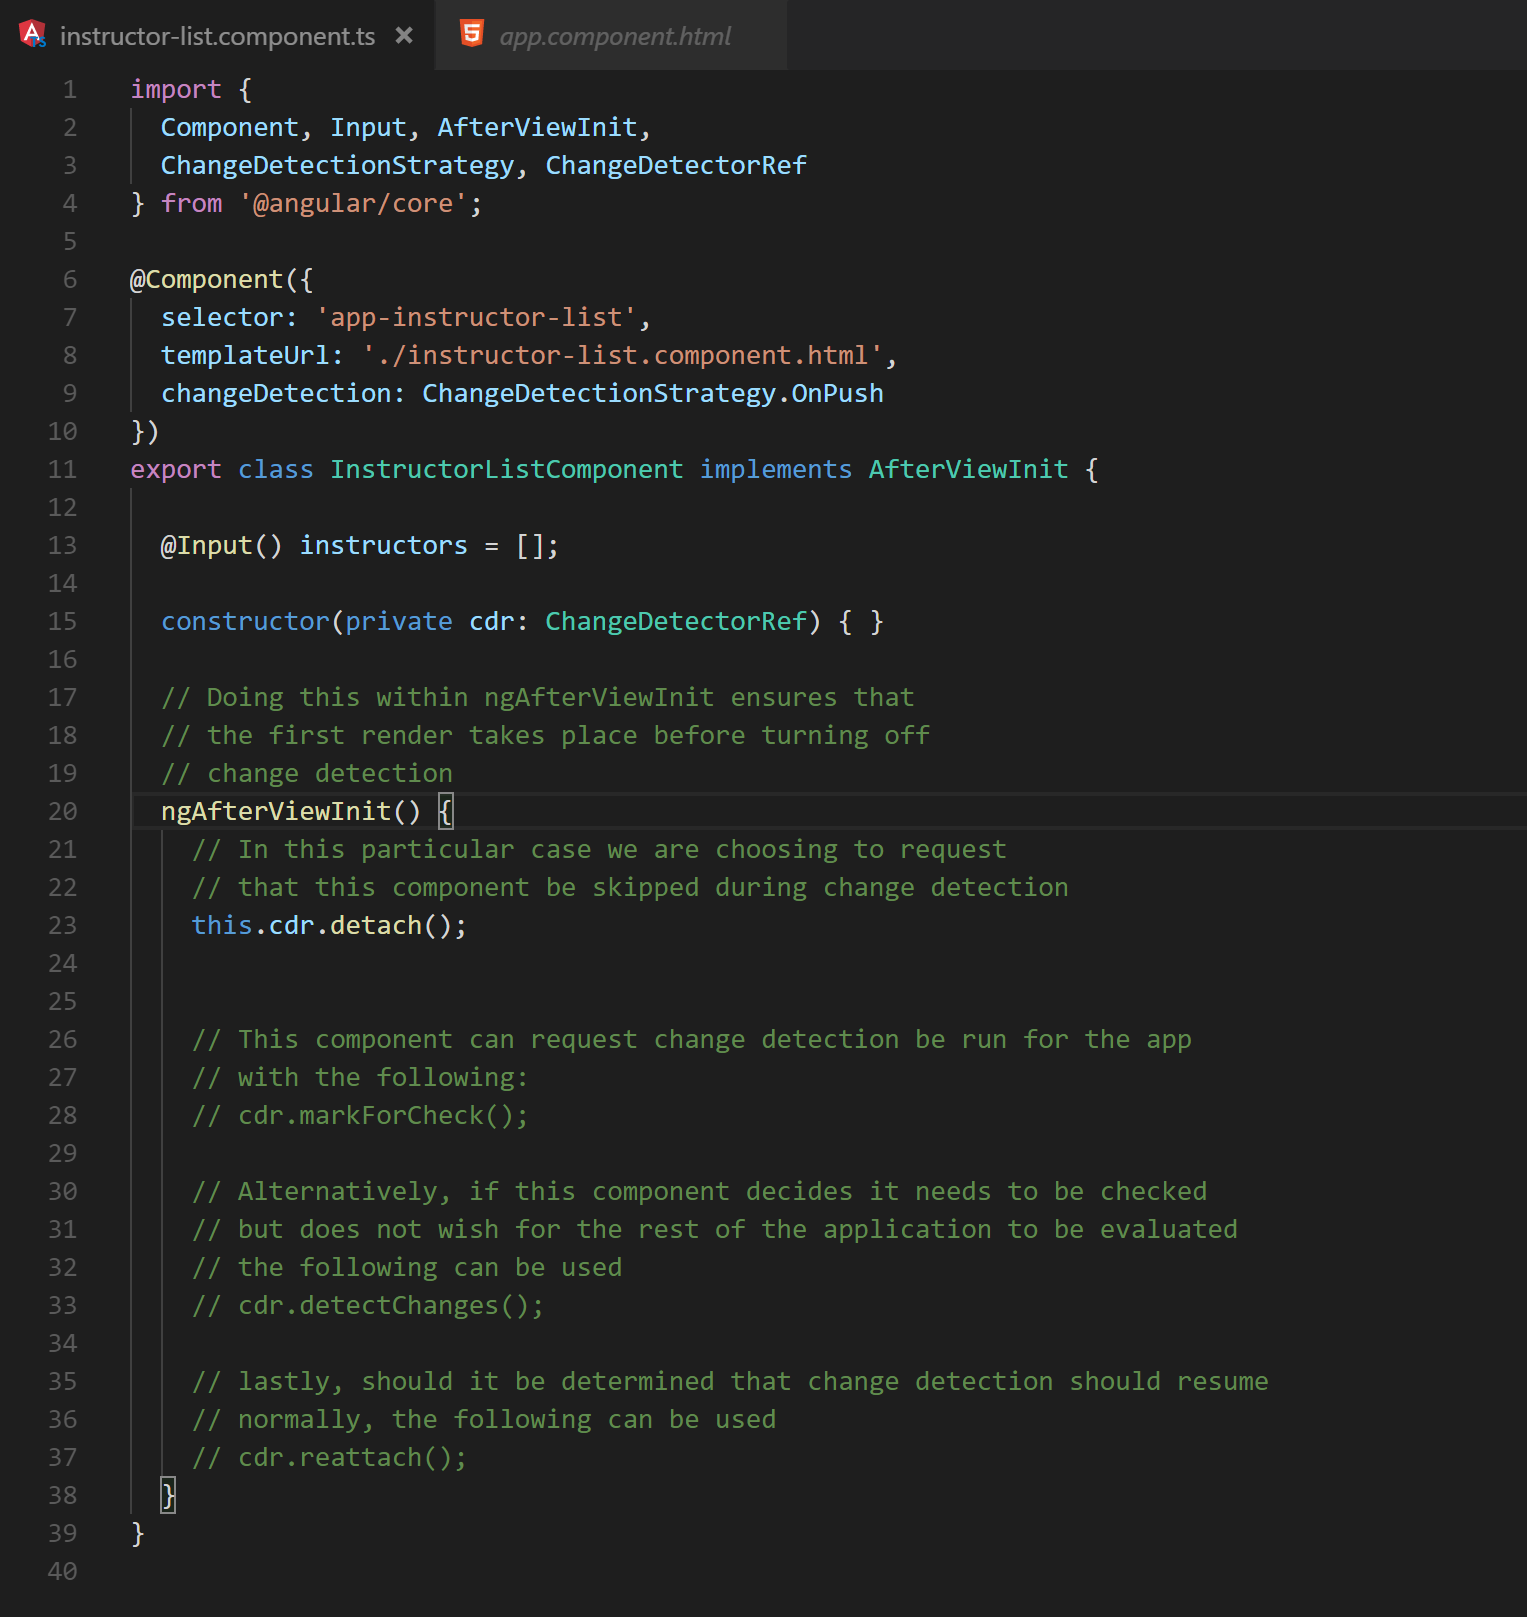
Fig. 18 A brief highlight of the API available for manual change detection

Another way to control change detection is to execute long-running code outside of change detection entirely. If a particular block of code can be executed asynchronously, Angular provides an API to mark a callback to run outside of change detection. Using this API will allow the current change detection process to complete and the browser to rerender. The callback will then execute; when it finishes, a new change detection cycle will begin to display the results.

Example Coming Soon!

For particularly expensive calculations, a web worker can be used in conjunction with manual change detection. The following repository contains an example that runs d3 force calculation – a particularly expensive operation – inside a web worker [2]. The results are returned after completion, and Angular is informed that change detection is needed using a component change detector reference.

https://github.com/dpsthree/angular-performance-playground/blob/master/src/app/d3-helper.service.ts

6.0 Reducing the duration of change detection

During change detection, Angular checks which data bindings need to be updated to apply the most recent changes. Features built into Angular can be leveraged to speed up this process; similarly, there are pitfalls that can make this process slower.

6.1 Template Methods

Angular has a very convenient feature that allows binding data directly to the result of a method call. By using Angular’s template binding syntax to assign an attribute to a method, the results will be recalculated with every change detection cycle. While this can be convenient, it also adds the results of these calculations to the cost of every change detection cycle. This cost has the potential to greatly impact an application’s responsiveness, for example, when binding to a method is combined with an ngFor. There are generally two approaches for improving performance when this happens: pre-computing the results or implementing the method as a pure pipe.

The most common situation in which an ngFor is combined with a method call is to perform a calculation based on each entry that is displayed. Rather than recomputing the display value on every change detection, there is often opportunity to calculate the additional properties as needed. For example consider the following code:

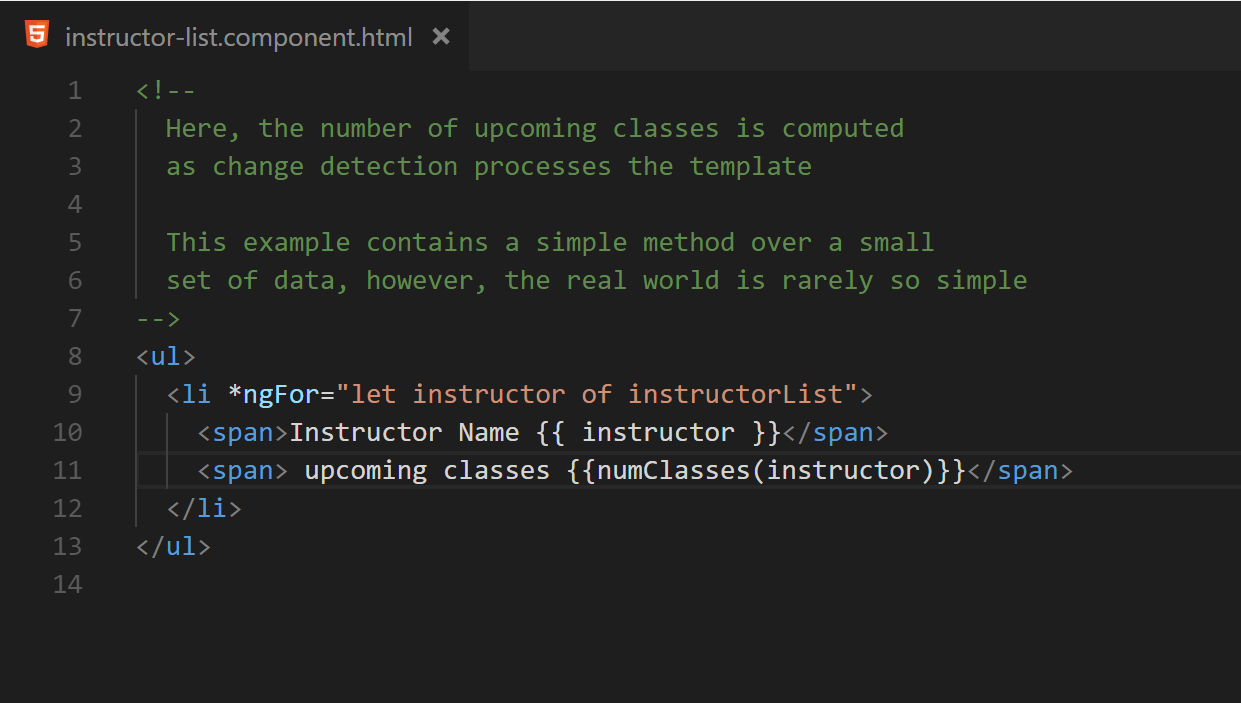
Fig. 19 (Before) A simple template binding that executes numClasses for each entry in instructorList on every change detection cycle

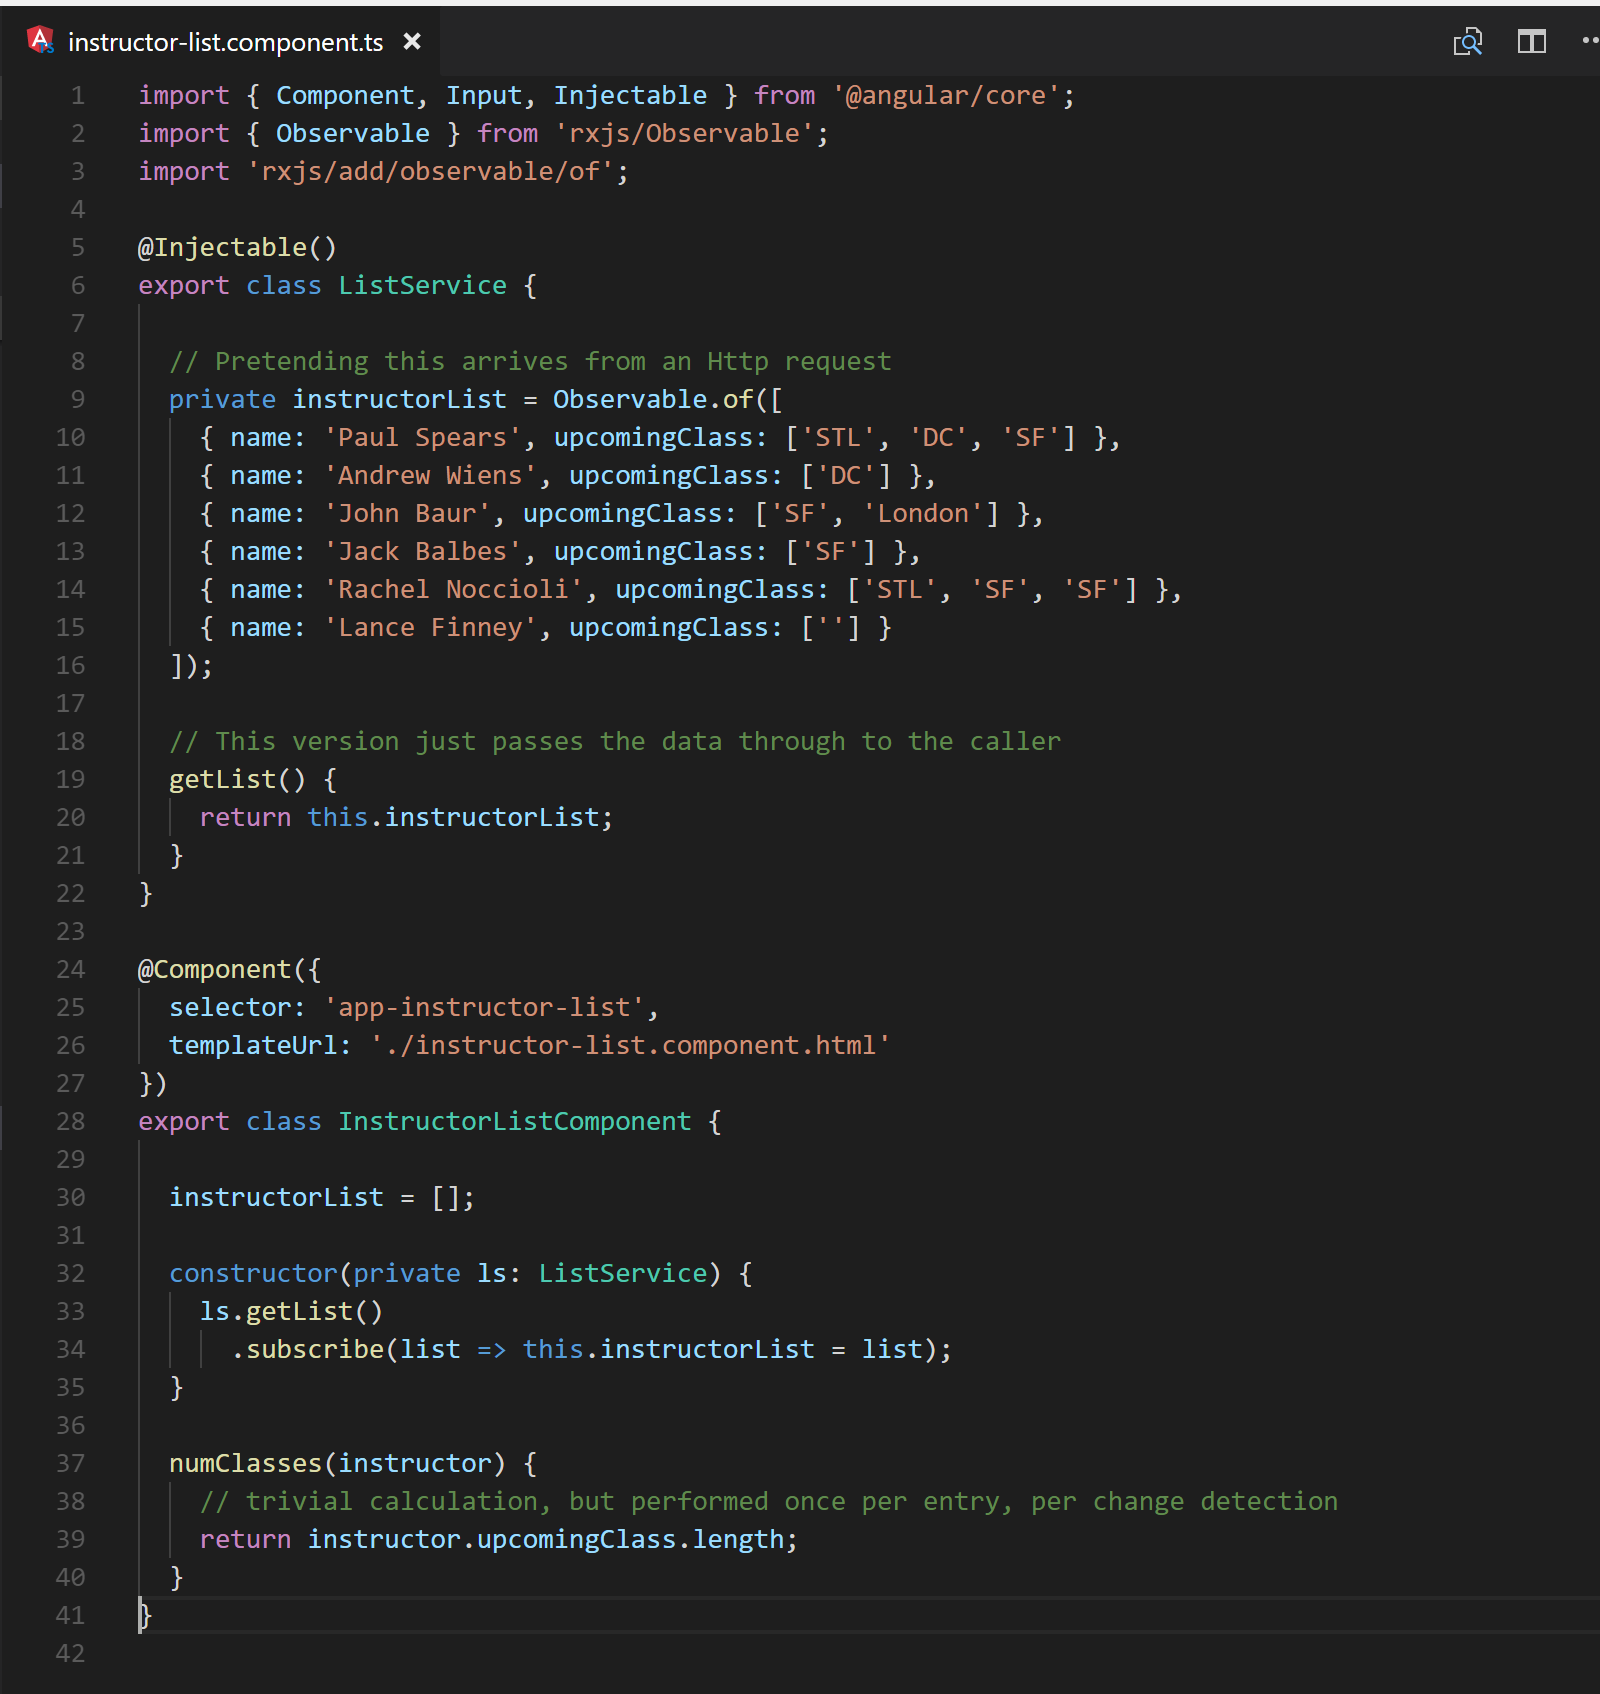
Fig. 20 (Before) The backing component class for the template sources its data with no upfront processing. Line 37 defines the method to call from the template

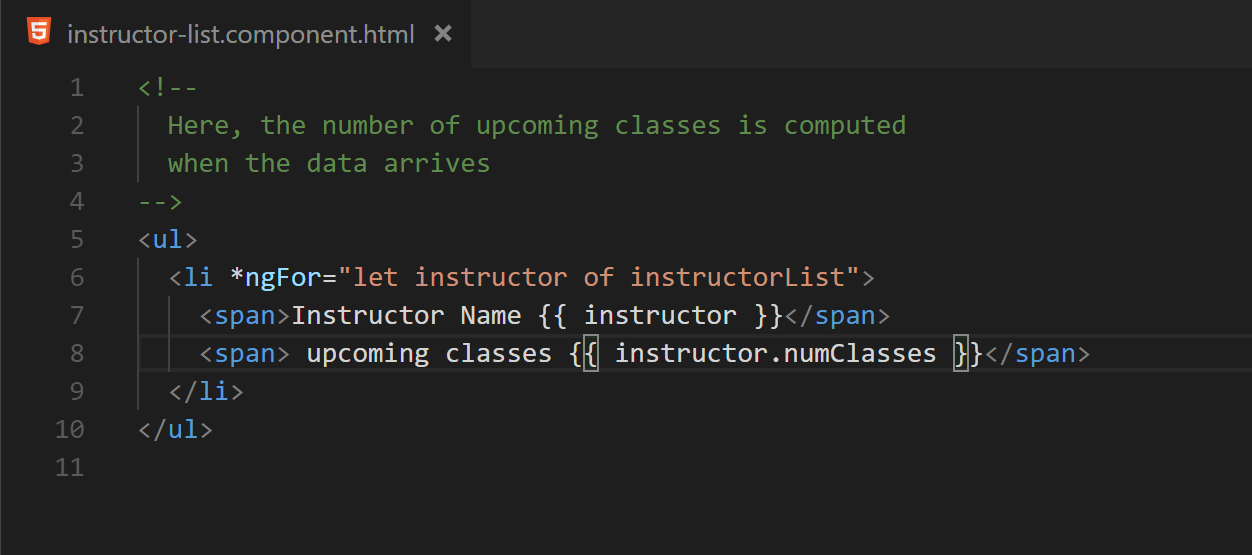
Fig. 21 (After) After some changes in how the instructorList is obtained, there is now a numClasses property that contains the desired value

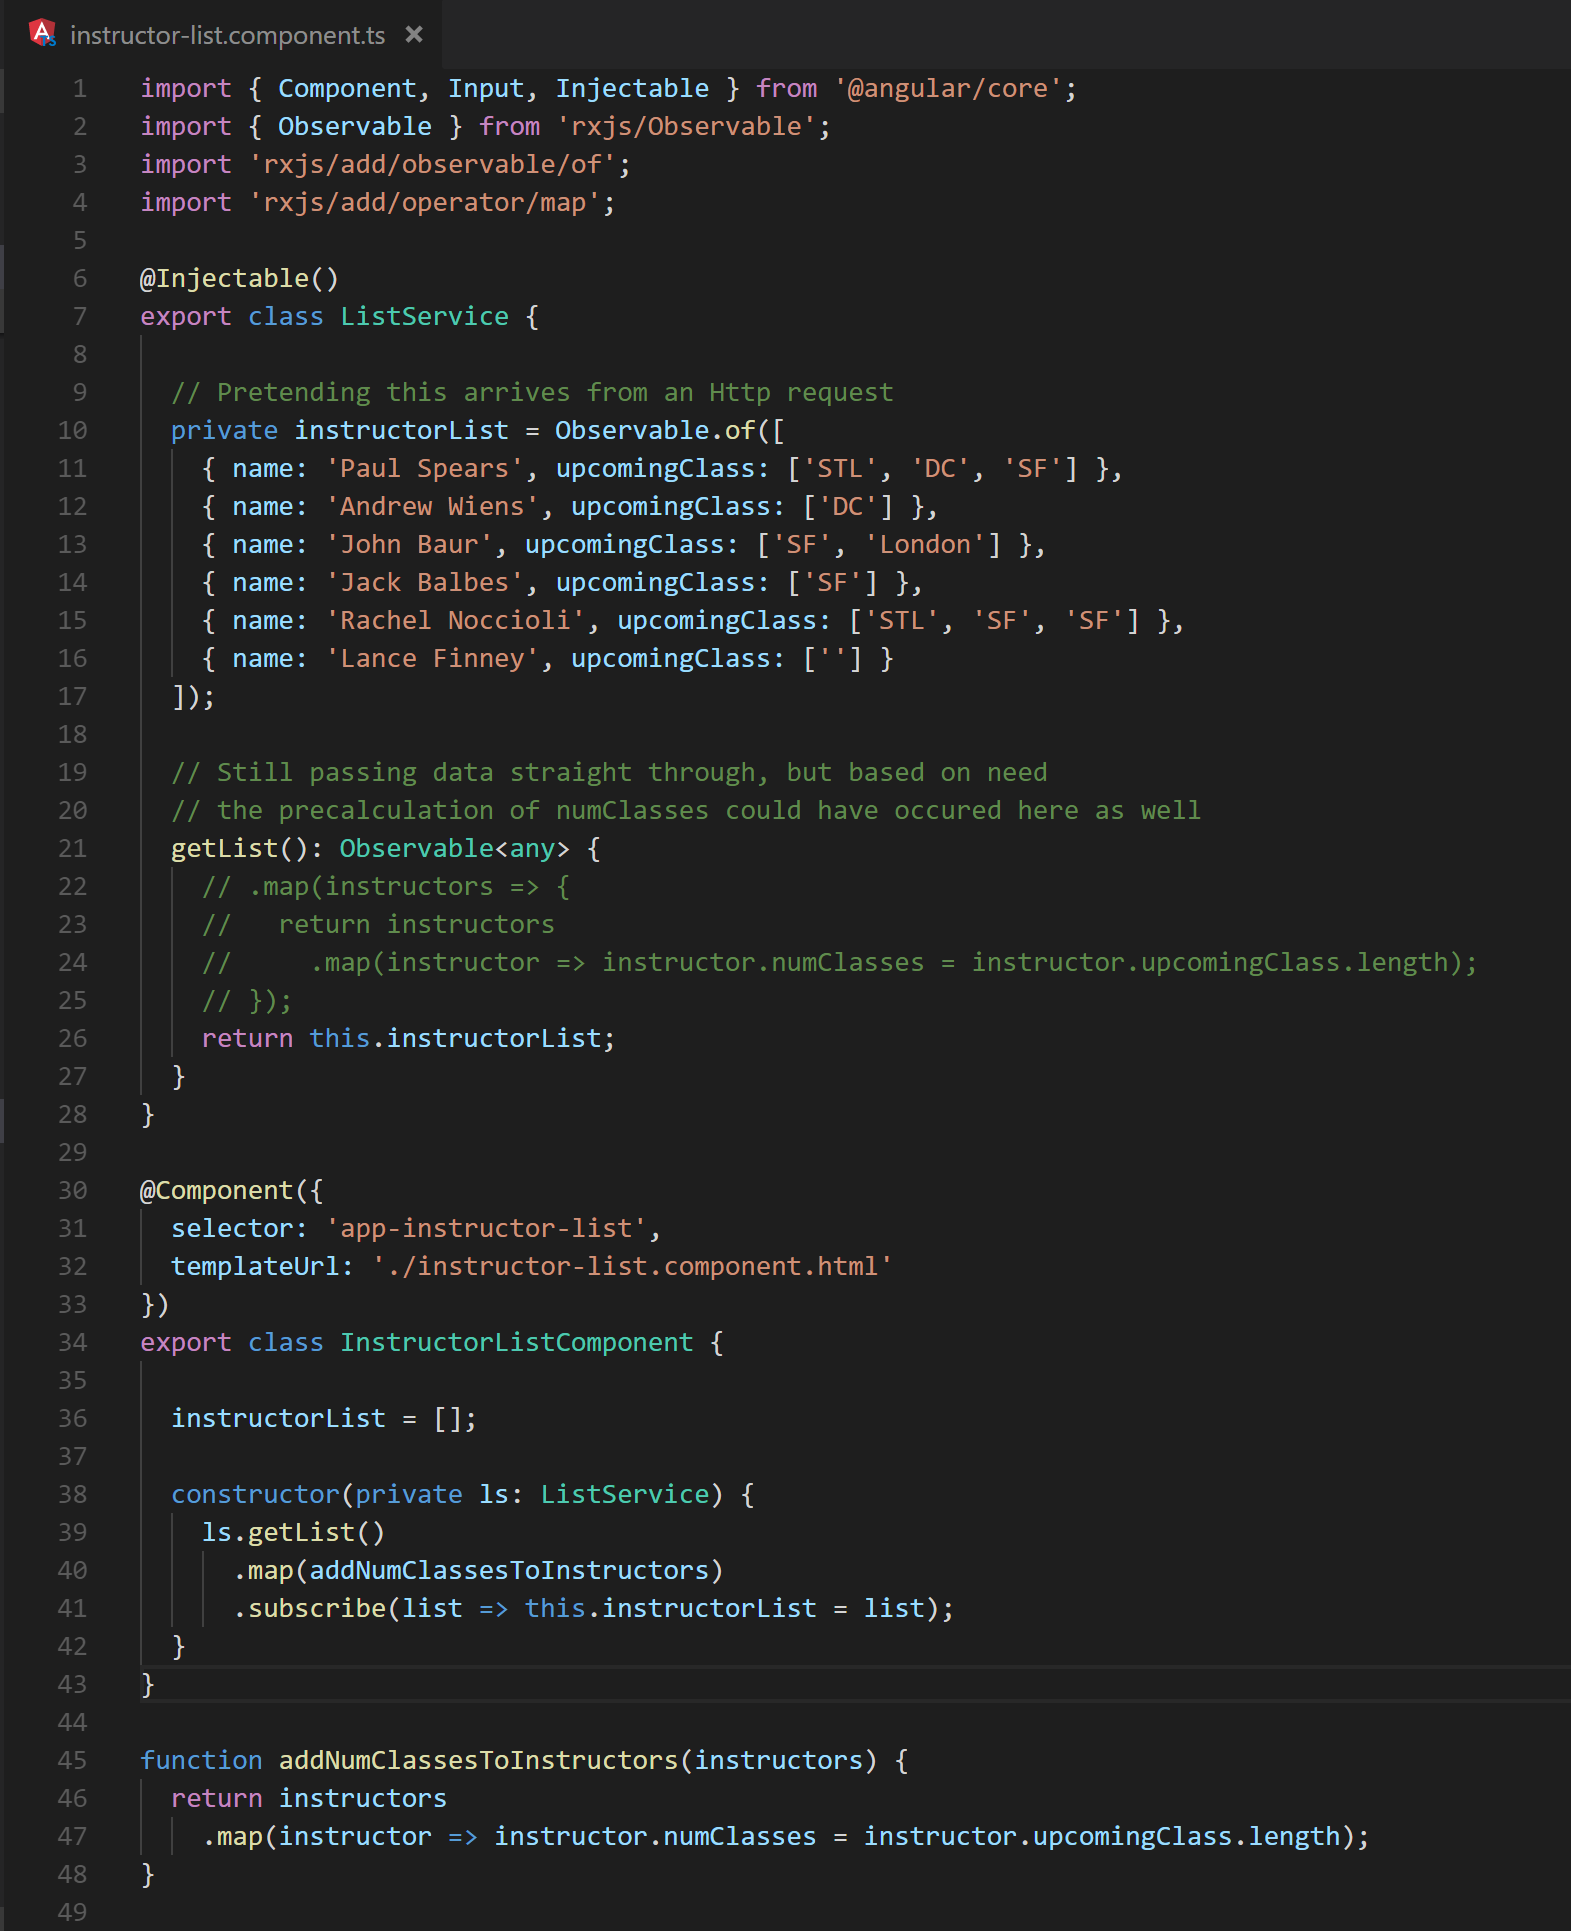
Fig. 22 (After) The backing component class demonstrates how the desired property could be computed upon retrieval and added to the objects.

In this example, object properties are only recalculated if the list changes. This occurs significantly less often than each change detection cycle, possibly never again. This is the most performant way to handle such situations, but it can sometimes be difficult to achieve.

Creating and using a custom pure pipe is generally far more convenient than restructuring the application’s data flow, but it is slightly less performant. A pure pipe is a pipe that behaves much like a pure function: The results of executing it are based solely on its input, and the input is left unchanged. When using a pure pipe in place of method bindings, the pipe is still executed each change detection cycle. However, the execution will benefit from the fact that Angular caches the results of previous executions: If a pipe is executed more than once with the same parameters, the results of the first execution are returned. As a result, although the pipe will still be invoked each change detection cycle in place of the method call, performance will benefit from the caching provided by Angular. Figures 23 and 24 demonstrate the previous example once more with the utilization of a pure pipe.

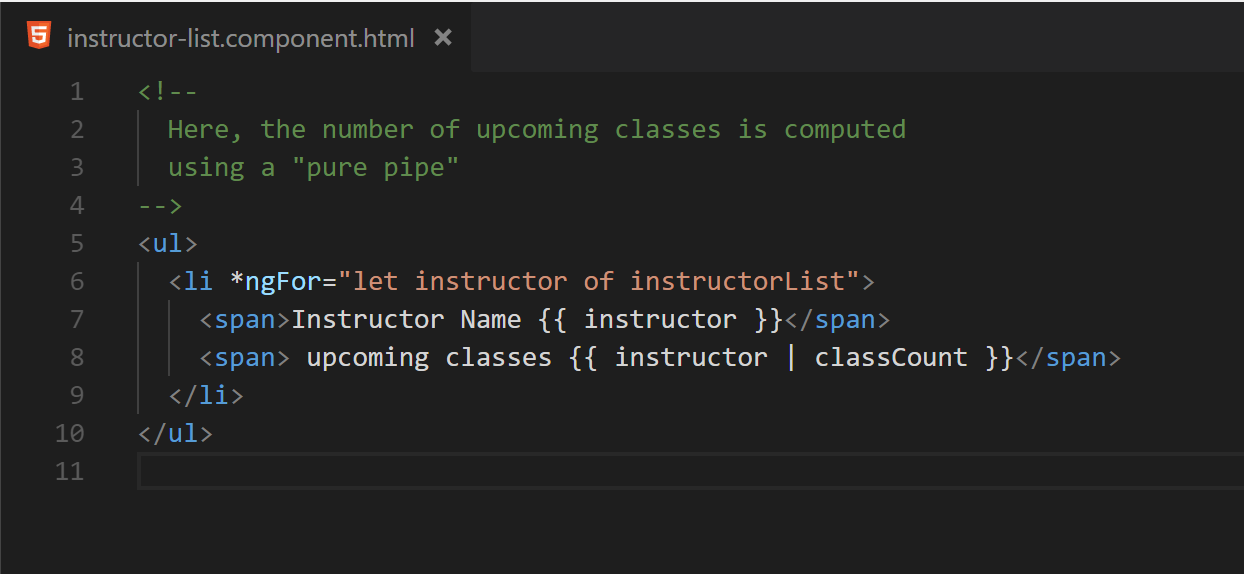
Fig. 23 The template now executes a pipe to produce the desired class count

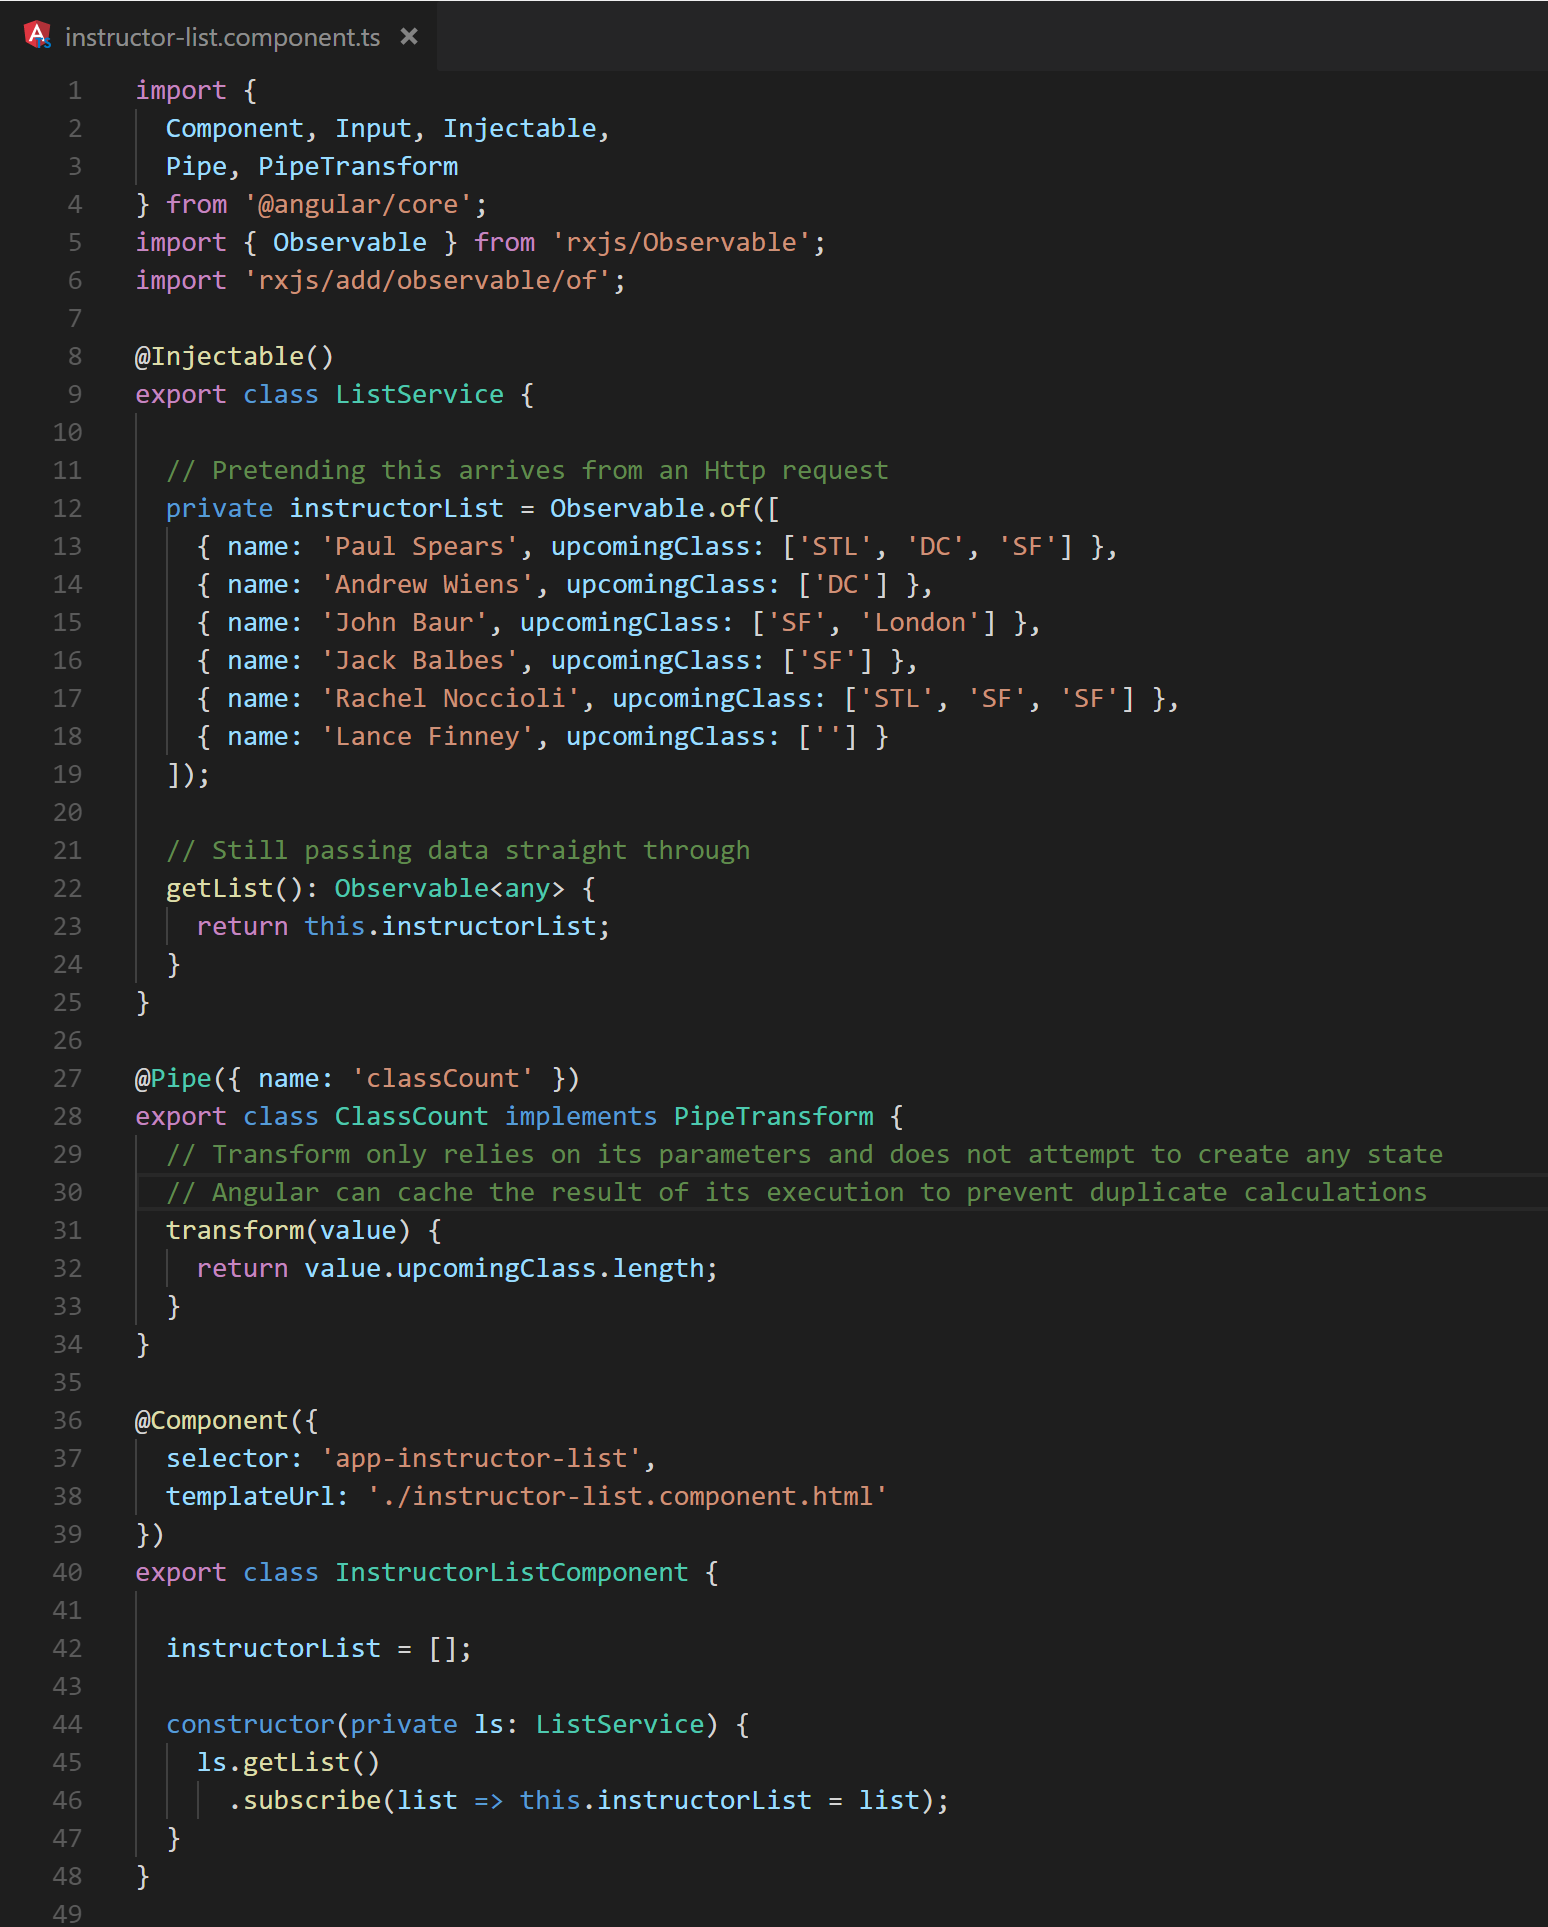
Fig. 24 A custom pipe is introduced, removing the need to precompute the additional data property.

6.2 ngFor

ngFor can also cause excessive DOM manipulation. By default, when iterating over a list of objects, Angular will use object identity to determine if items have been added, removed, or rearranged. This works well for most situations. However, if immutable practices are utilized when updating the data within the list, the identities will be updated and ngFor will generate a new collection of DOM elements to be rendered. If the list is long or complex enough, this will increase the time it takes the browser to render the change. To mitigate this issue, it is possible to use trackBy to tell Angular how to identify the entries as seen in figures 25 and 26.

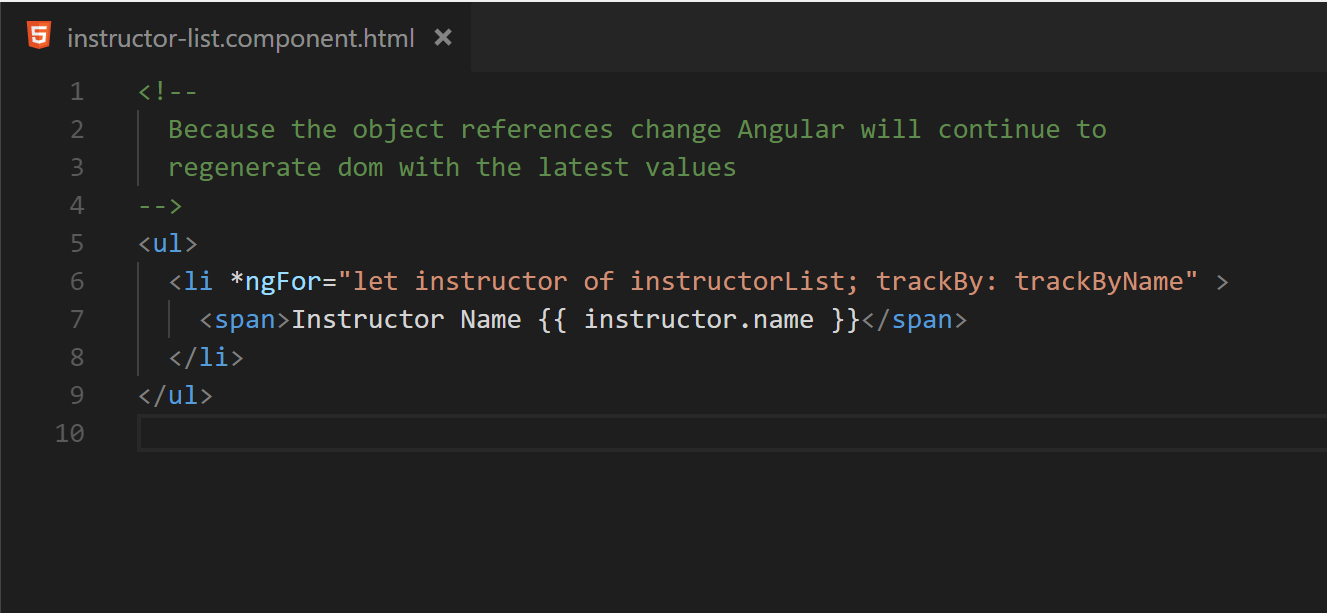
Fig. 25 Expanding a basic ngFor to utilize a trackBy method

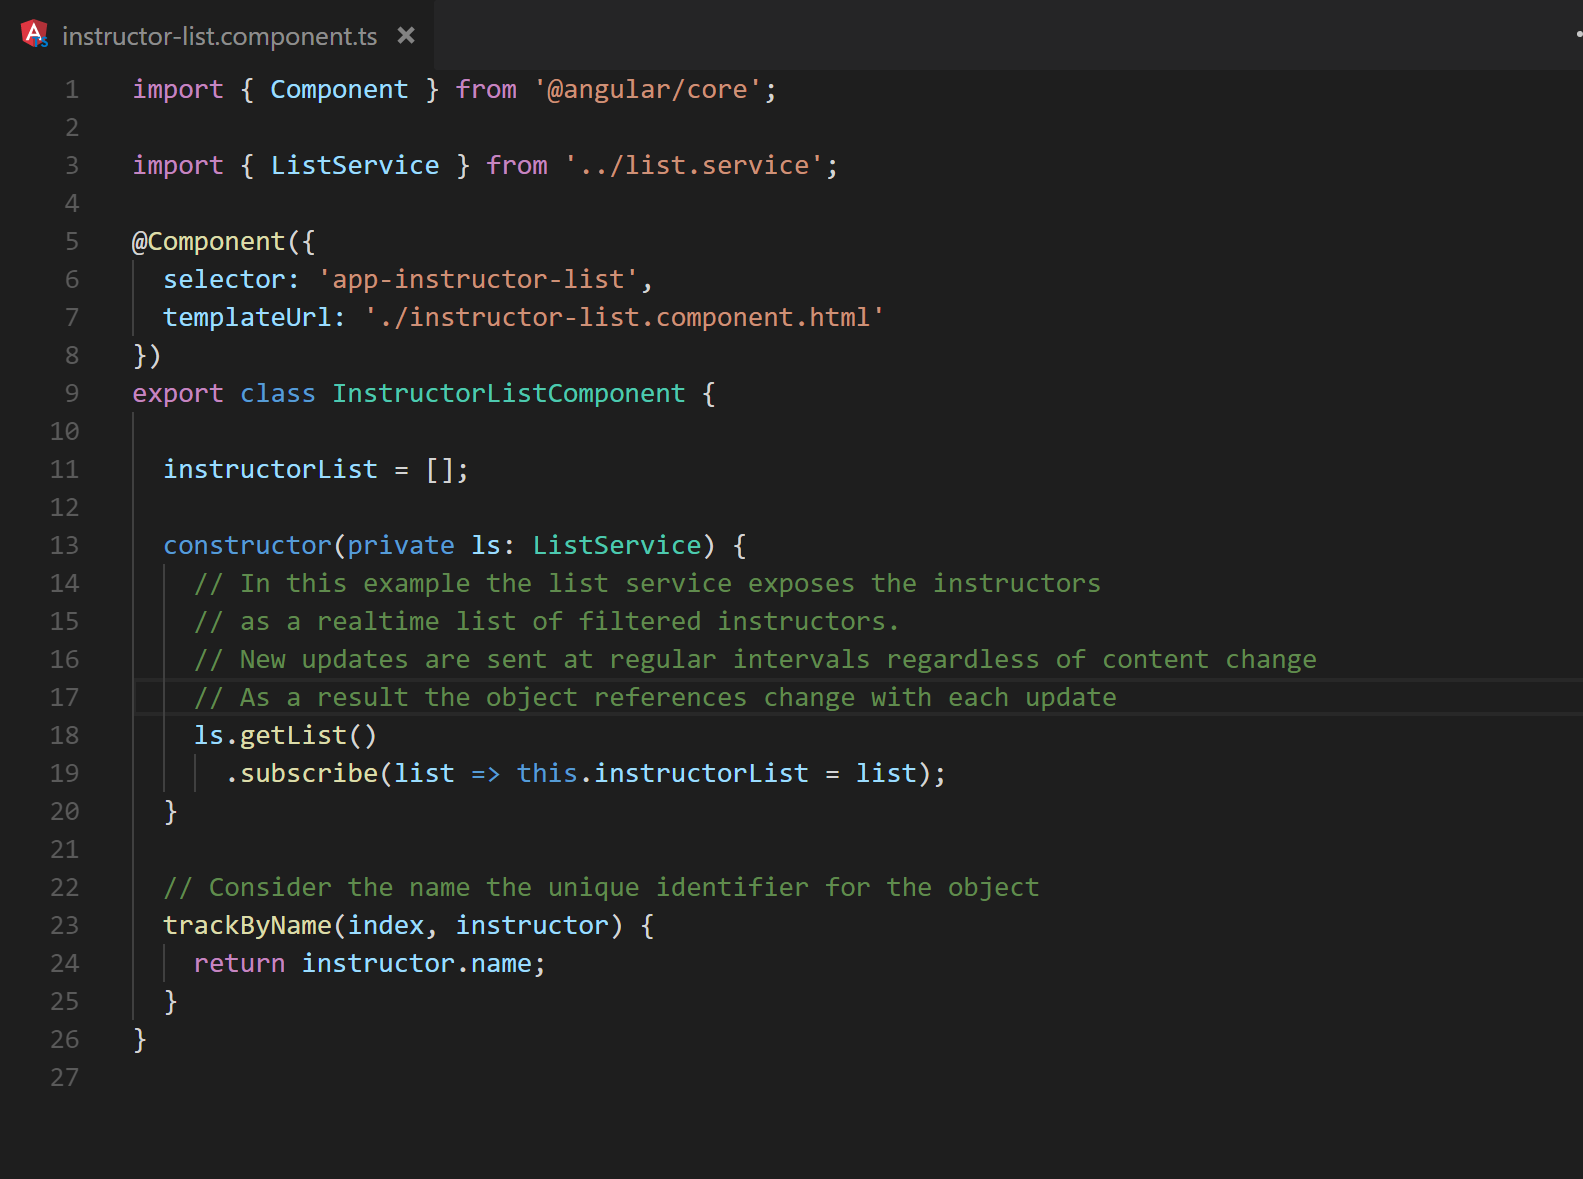
Fig. 26 Line 23 shows the method structure for a trackBy method.

This will reduce the amount of DOM regeneration needed to render any changes even in the case of rapid changes to an immutable data set.

6.3 AOT

The goal of change detection is to translate data changes into a newly-rendered view by updating DOM attributes. Angular runs in just-in-time (JIT) mode by default where its interpretation of component templates is executed as part of the digest cycle. This mode of operation is great when building and debugging an application, but it adds significant overhead in the browser at run time. Compiling Angular using the command line interface (CLI) with both prod mode and ahead-of-time (AOT) compiling reduces this overhead by precompiling the application’s component templates and removing the need for JIT processing.

7.0 Observable Pipelines

Observables are a powerful abstraction for dealing with asynchronous events. Proper usage can result in drastically reduced line counts in an application. However, as a source of change in Angular applications, they should be subject to the same performance scrutiny as component event handlers and change handlers. Observables are closely related to all three of the primary points listed in section 2.0. As such, it is crucial to select the right operators and understand how they are used to ensure that an application’s performance is not degraded by their use.

7.1 distinctUntilChange

When using Observables it is not uncommon that an Observable may emit consecutive duplicates. Depending on the situation it may not be of any benefit to reprocess the same data twice. Rxjs provides an operation, distinctUntilChanged, that will filter any duplicate, consecutive updates from flowing downstream [6]. This operation is shown in Figure 27 as a marble diagram by RxMarbles [7].

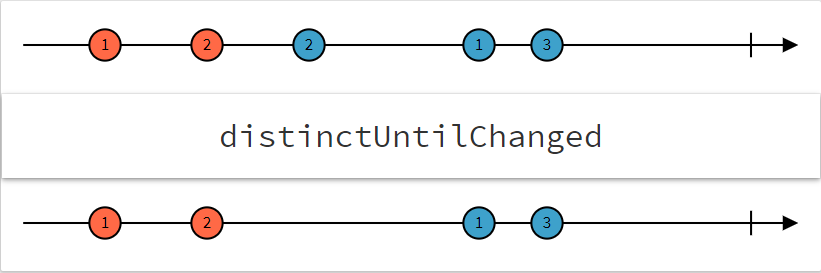
Fig. 27 Marble diagram showing how values pass into and out of distinctUntilChanged

7.2 share

It is quite common in an Angular application to use the data that flows out of an Observable in more than one location. When this happens all of the upstream processing needed to produce the data executes once for each subscription and usage of async pipe. If the callback in the Observable pipeline contain any sufficiently lengthy calculations the cost will add up quickly. Ideally the computation would be executed once for each unique update and the result would be made available to all subscribers. This can be achieved with the observable operator share [8]. Figure 28 utilizes share by sending the result of the Http call into a list display as well as a method used to calculate the total number of classes. In the absence of share, any processing that may be added between lines 12 and 16 of Figure 29 (as well as the Http request!) will be executed for each reference to “results”.

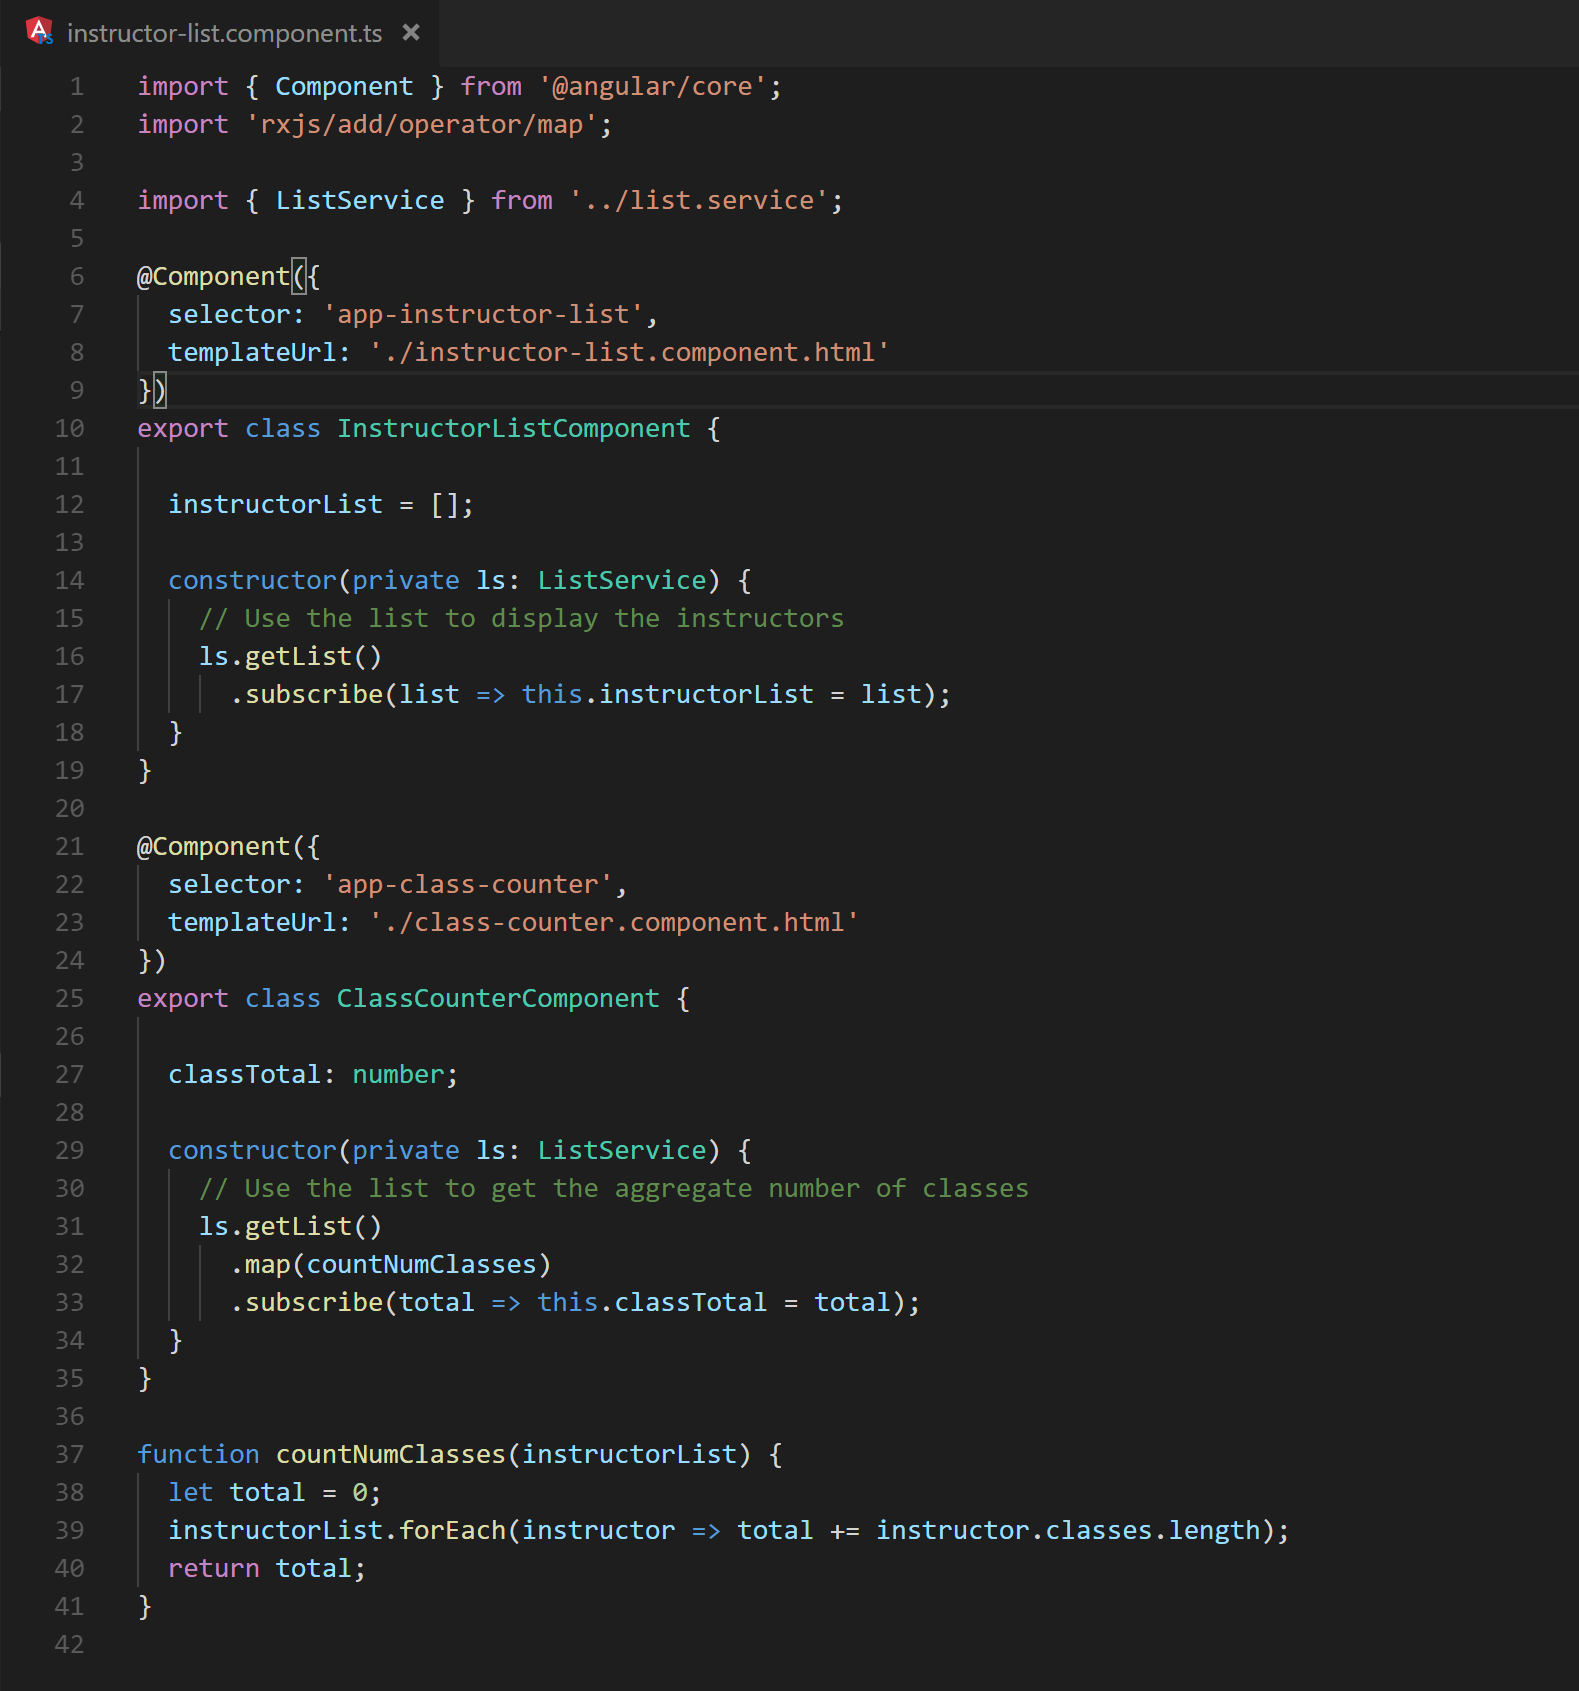
Fig. 28 Lines 16 and 31 demonstrate separate uses of the same Observable data.

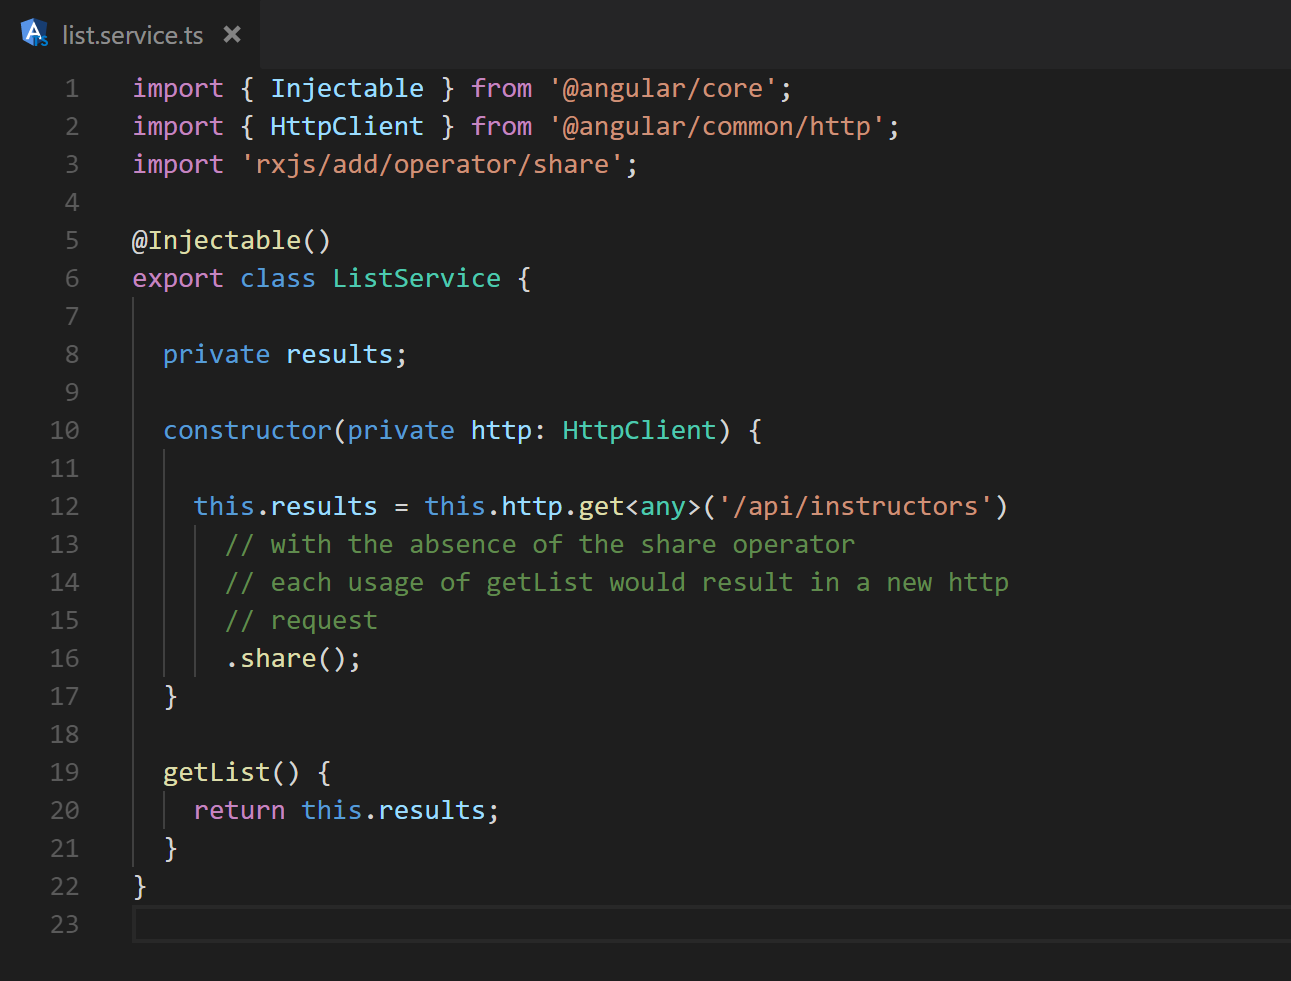
Fig. 29 share is introduced on line 16 to prevent extraneous calculations

7.3 withLatestFrom

Another common use case with Observables is the need to combine multiple streams of data together to calculate some results. This is most often achieved with the usage of the combineLatest operator. As the name implies it is used to combine the latest results from each Observable that is passed in. The callback is passed the results and executed each time any of the supplied observables receive an update. There are situations however, where the calculations need only run when one specific observable changes, but the most recent values of other others are still needed for calculation. In these scenarios it is possible to reduce the number of executions by switching to withLatestFrom [9]. As described above, withLatestFrom will rerun the desired calculation only when the observable it is applied to changes, but makes available the most recent values of all other observables passed as parameters. This operation is shown in Figure 30 as a marble diagram.

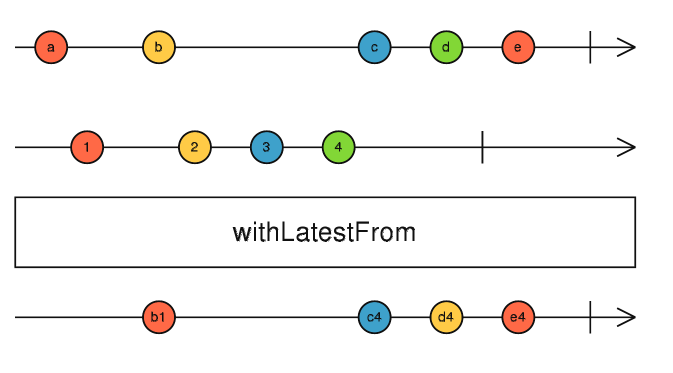
Fig. 30 Marble diagram showing how values pass into and out of withLatestFrom

7.4 throttleTime

Some forms of streaming data occur at a very high frequency. Though it may not be necessary to display each update in the UI. Some use cases only require notifying the user of updates once every n milliseconds. In these situations it may be possible to utilize an operator called throttleTime [10]. This operation is shown in Figure 31 as a marble diagram.

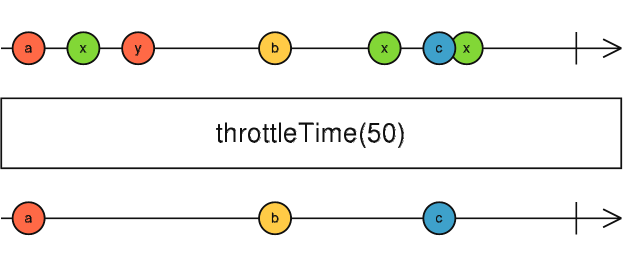
Fig. 31 Marble diagram showing how values pass into and out of throttleTime

8.0 Conclusion

Angular’s change detection system is incredibly quick. However, the ease that Angular affords developers to synchronize custom application functionality to UI updates makes it possible to create unintended performance bottlenecks. Knowing where to look to eliminate these bottlenecks can be difficult. Armed with the performance improvements outlined in this guide, a motivated Angular developer can meet runtime performance needs by designing the application to use Angular’s resources optimally or moving code blocks outside of the Angular layer.

9.0 References

  1. http://expium.com/visualizer-for-jira
  2. https://www.angularperformanceplayground.com/app/graph
  3. https://vsavkin.com/change-detection-in-angular-2-4f216b855d4c
  4. https://blog.nrwl.io/essential-angular-change-detection-fe0e868dcc00
  5. https://github.com/dpsthree/angular-performance-playground/blob/master/src/app/d3-helper.service.ts
  6. http://reactivex.io/rxjs/class/es6/Observable.js~Observable.html#instance-method-distinctUntilChanged
  7. http://rxmarbles.com/http://reactivex.io/rxjs/class/es6/Observable.js~Observable.html#instance-method-share
  8. http://reactivex.io/rxjs/class/es6/Observable.js~Observable.html#instance-method-withLatestFrom
  9. http://reactivex.io/rxjs/class/es6/Observable.js~Observable.html#instance-method-throttleTime

Product Development Launch – Default Software and Practices Stack

Context

Here at Oasis Digital, some of our projects are (approximately) “green field” product development launches. The scope of such a project typically includes some CRUD-like features, but also a complex-behavior feature or two. The effort typically lasts a few weeks or at most a few months, after which work is transitioned to customer developers (or occasionally to longer-term ongoing work here).

During a product development launch, we typically demonstrate:

  • Key goals are around user experience, UI development, etc
  • Key use cases of a system
  • Working software, sufficiently deployable for demonstrations
  • Feasibility and suitability of a technology stack, client and server side

Importantly though, during such a launch effort the long-term viability of the underlying customer vision is not yet fixed nor proven. Rather, a product launch refines the vision and proves the potential value.

Executing a product launch

For the reasons above, it is vital that we execute a product development launch expediently. The process is typically something like so.

  • Understand the vision and goals
  • Collaboratively define some key use cases, and key user experiences
  • Defer as much complexity as possible, outside of these key use cases; don’t let the development launch turn in to just a planning effort
  • Choose off-the-shelf tooling to facilitate quick implementation
  • Define key screen flows for the use cases
  • Consider what data appears on each screen (report, integration, etc.), and the flow of data through the system
  • Define an initial “schema of the system”, iteratively through the launch effort
  • Work on an iterative cadence so that we can get through at least several significant iterations during the short project duration

All of that is just context though; what I really want to talk about here is our default software stack for launching a fresh new project. These are just defaults; they often vary by the needs of a specific project, customer, deployment context, etc.

Client / UI

As of 2017, we generally default to a single page web application powered by Angular. While we also work in React and other tools, Angular is where we have the greatest shared experience (from extensive development work, as well as from teaching Angular Boot Camp) and therefore the greatest immediate collaborative productivity.

Angular is also the technology area where we innovate most. We use it for many projects, we train on it, we follow its development closely, we participate in open source. We attend and sponsor conferences. We are connected with the Angular community.

At the same time, customers coming to us for a product launch are typically most interested in seeing a working user interface that demonstrates their vision. Therefore the greatest share of our work in a product development launch is in the user interface.

Server

Because typically our time is focused primarily on user interface/client-side work, it is important to have a set of highly effective tools with which we can execute well-understood server-side APIs very quickly. Therefore, we default to:

  • Java
  • Spring Boot
  • Spring JPA / HIbernate
  • Various other ancillary related libraries and tools
  • A transaction scripting approach for the handful of complex use cases in a bunch effort

These tools are, perhaps to a 2017 eye, somewhat boring. But they are boring because they are well proven, they work. They very rarely yield, within the scope of initial development, any significant obstacles to delivery. That makes them very well suited for a short-duration effort.

Because these tools are so well proven, and because they permit a mostly declarative implementation approach, the resulting small code base warrant little automated testing at the beginning.  We don’t need tests to show that this stack can correctly implement a RESTful API; if it had any trouble doing so, we would replace the stack, not nitpick it with tests.

(While Java is the typical default, we also frequently use Node and related libraries instead; there is a trade-off here between less mature tools, versus the payoff of using more similar technology between client and server code.)

GraphQL

Sometimes things are not quite as boring as they seem though. If the data to be fetched is complex, we typically pick up GraphQL to slash the code quantity and development time for complex data fetching. Data volumes are usually modest during a short-term launch effort, so a straightforward lazy fetching approach via GraphQL resolvers (which go by another name in some implementations) does the job with little effort. This sometimes results in “N+1” database query operations – a problem to be solved later in development, once the scaling and performance attributes are understood.  GraphQL provides a means to do those optimizations, which we defer until they are needed.

Database

At the database layer, we innovate the least. We typically recommend a common and well-proven relational database. Our default is PostgreSQL, although sometimes customer deployment needs may result in MS SQL Server or another RDBMS.

Product development launch efforts are about speed, so we don’t the database schemas by hand. We define data structures in program code then use the tooling (for example, a JPA implementation) generate the schema. Data migration is also generally not an issue in a short-term launch effort; those come into play in a longer lived project which goes in production with data to preserve across versions.

Deployment

Large, long-term software projects will end up with specialized operations experts who shepherd them through critical infrastructure – but this post is about short product launch projects. These projects need to be made visible for review, demonstration and so on, long before the organizational wheels can turn for serious deployment infrastructure.

Therefore, we typically simply deploy the software for demonstration, to a cloud server instance of some kind (AWS, Google Cloud, Digital Ocean, etc), with minor scripting or tooling to automate deploying new versions frequently (sometimes even at every commit) during development. This is not scalable, and not nearly as automatable as more robust solutions, but it is a perfect starting point for something to put in place right away.

Quality

During a short-duration project effort, we write code quickly, but still keep a close eye on quality. Writing good code typically results in faster progress, beyond the timescale of the day or two.

What about the rest of the tools and practices?

Reading back over this description of the choices we make to launch an effort quickly, you might get the impression that we don’t deploy modern techniques, that we haven’t heard of all of the latest (or decades worth) of buzzwords. On the contrary, we have a full array of additional techniques to apply as a project grows in scope, size, and duration.

Micro Services

For certain projects, a micro service architecture produces numerous benefits. But even the esteemed software architect Martin Fowler suggest starting with a monolith: https://martinfowler.com/bliki/MonolithFirst.html

Unit testing

During a product launch, much of the code is boring ordinary use external libraries, which needs very little unit testing. But a project that grows beyond the initial launch will need lots of unit testing around any logic of complexity or interest.

API testing

As APIs become more complex, they warrant thorough test coverage – so a project that grows will get that coverage.

E2E Testing

A product launch effort typically yields a modest number of screens, undergoing rapid change, therefore unsuitable for browser-based end to end automated testing. Therefore, we skipped that during the launch effort.

We don’t forget though – here at Oasis Digital we are very big fans of automated E2E testing, and have seen it pay off on a daily basis, for most any project that lives more than a few months.

NoSQL

NoSQL can solve a great number of problems, and we recommend this type of data store when it is needed. This rarely occurs in the first month or two of the project when the vision and user experience are still being understood.

CQRS / DDD / ES

We have used these techniques extensively, as you can read about elsewhere on our blog. But we mostly set these skills aside during a fast product launch, these are things that pay off its scale but which can make it hard to get to scale as they are allowed to consume too much time early in a project.

Planning and Methodology

During a short launch effort, planning happens primarily via a whiteboard, or spreadsheet, or similar tool. If the values proven in vision works, a project may grow large enough to warrant more complex planning and project management.

Issue tracking

Although we work extensively with issue tracking technology (our sister company builds add-on products and provide services around Atlassian Jira), during a product launch effort our issue tracking approach is intentionally very lightweight. Issues that won’t get attention during the launch effort, are simply listed somewhere tersely. Issues that need attention right away, typically get attention right away, or at are tracked in some lightweight manner. A product launch effort that lasts only a few weeks to a few months might or might not use a “real” issue tracker in that short time, while an effort that grows to a long-term project will use one extensively for tracking, planning, support, etc.

Much more

This is just a short sampling of practices and how they may apply differently at the beginning of a short effort versus late into a large one.

Frameworks and commercial ecosystems

Or, “why we don’t teach Aurelia”

Here at Oasis Digital and its sister company (Expium), we offer training and services concentrated around various languages and frameworks:

  • Angular
  • TypeScript
  • Node
  • The web platform in general
  • JIRA, Confluence, and other Atlassian products (Expium is an Atlassian Solutions Partner)

There are many reason – technical, history, intentional, and accidental – around how we ended up with this set of technologies as our 2017 training and consulting focus.

I was reminded of one key factor today while watching a video from last year of a talk by Rob Eisenberg. Rob is exceptionally sharp, and seems to have a good sense of taste in designing frameworks for developer satisfaction. But I found myself in disagreement over his thoughts around web framework adoption. Rob argues that frameworks like his (Aurelia) are stronger, better choices to build on than frameworks like Angular and React, because first-party training and support services are available for Aurelia from the makers of Aurelia. This initially seems like a compelling pitch, I can see how it would woo some decision-makers. Here is a snippet of one of the slides along these lines, pointing out first party training as an advantage:

But I think ultimately this works out much less well than Rob describes. Why? Because this first party set of training and consulting offerings leave less space for a thriving commercial ecosystem to develop around a framework.

Let’s look at Angular for example. Here at Oasis Digital, we aim to be a leader among many firms around the world, who provide training, consulting, etc. for Angular. Our customers are quite happy with the availability of these services from many different companies; it reduces their risk and means they can shop around for the best fit. Moreover, because Angular has created opportunities for companies like Oasis Digital, it has facilitated a growing commercial ecosystem revolving around the framework. Much the same applies, for example, to React and Vue.js. This is a virtuous cycle. The non-service-offering core team leaves room for others to provide services, which in turn makes it easier and safer for customers to adopt the framework.

(A second example at Oasis Digital’s sister company Expium: Expium focuses entirely on the Atlassian product suite. While Atlassian offers online video training options, Expium’s offerings include things like live human training that don’t compete directly with Atlassian’s offerings. Atlassian enjoys a thriving commercial ecosystem.)

Of course it would be possible for companies like us to offer training and consulting focused on Aurelia. But we don’t want to do that; we like the people responsible for the framework. If we offered services for Aurelia, we would have an inherently competitive relationship with the company behind Aurelia, vying for the same customer opportunities.

This situation applies to various other frameworks and other technical specialties that we could choose to focus on; with so many choices, it inevitably feels wiser to choose those where we can be allied with the core teams rather than in competition with them.

I believe that overall, this is quite important in understanding why some frameworks gain enormous momentum and others do not. Creating this kind opportunity for a commercial ecosystem is an immense competitive advantage to those companies who can offer a framework without needing to build a business directly around it – like Google and Angular.